
.gif)
Polar curve (aviation)
Encyclopedia
A polar curve is a graph
which contrasts the sink rate of an aircraft
(typically a glider
) with its horizontal speed.
is important in exploiting the performance of a glider. Two of the key measures of a glider’s performance are its minimum sink rate and its best glide ratio, also known as the best 'glide angle'. These occur at different speeds. Knowing these speeds is important for efficient cross-country flying. In still air the polar curve shows that flying at the minimum sink speed enables the pilot to stay airborne for as long as possible and to climb as quickly as possible, but at this speed the glider will not travel as far as if it flew at the speed for the best glide. When in sinking air, the polar curve shows that best speed to fly depends on the rate that the air is descending. Using Paul MacCready
's theory, the optimal speed to fly for best cross country speed may often be considerably in excess of the speed for the best glide angle to get out of the sinking air as quickly as possible.
s and descend 2 nautical miles (4 km). The glide ratio is 20 using both methods.
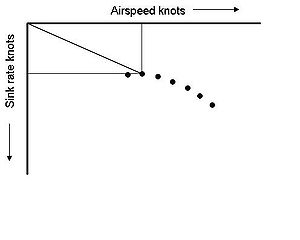
The origin
for a polar curve is where the air-speed is zero and the sink rate is zero. In the first diagram a line has been drawn from the origin to the point with minimum sink. The slope of the line from the origin gives the glide angle, because it is the ratio of the distance along the airspeed axis to the distance along the sink rate axis.
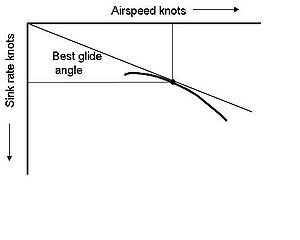
A whole series of lines could be drawn from the origin to each of the data points, each line showing the glide angle for that speed. However the best glide angle is the line with the least slope. In the second diagram, the line has been drawn from the origin to the point representing the best glide ratio. The air-speed and sink rate at the best glide ratio can be read off the graph. Note that the best glide ratio is shallower than the glide ratio for minimum sink. All the other lines from the origin to the various data points would be steeper than the line of the best glide angle. Consequently, the line for the best glide angle will only just graze the polar curve, ie it is a tangent
.
Graph of a function
In mathematics, the graph of a function f is the collection of all ordered pairs . In particular, if x is a real number, graph means the graphical representation of this collection, in the form of a curve on a Cartesian plane, together with Cartesian axes, etc. Graphing on a Cartesian plane is...
which contrasts the sink rate of an aircraft
Aircraft
An aircraft is a vehicle that is able to fly by gaining support from the air, or, in general, the atmosphere of a planet. An aircraft counters the force of gravity by using either static lift or by using the dynamic lift of an airfoil, or in a few cases the downward thrust from jet engines.Although...
(typically a glider
Glider (sailplane)
A glider or sailplane is a type of glider aircraft used in the sport of gliding. Some gliders, known as motor gliders are used for gliding and soaring as well, but have engines which can, in some cases, be used for take-off or for extending a flight...
) with its horizontal speed.
Measuring a glider's performance
Knowing the best speed to flySpeed to fly
Speed to fly is a principle used by soaring pilots when flying between sources of lift, usually thermals, ridge lift and wave. The aim is to maximize the average cross-country speed by optimizing the airspeed in both rising and sinking air...
is important in exploiting the performance of a glider. Two of the key measures of a glider’s performance are its minimum sink rate and its best glide ratio, also known as the best 'glide angle'. These occur at different speeds. Knowing these speeds is important for efficient cross-country flying. In still air the polar curve shows that flying at the minimum sink speed enables the pilot to stay airborne for as long as possible and to climb as quickly as possible, but at this speed the glider will not travel as far as if it flew at the speed for the best glide. When in sinking air, the polar curve shows that best speed to fly depends on the rate that the air is descending. Using Paul MacCready
Paul MacCready
Paul B. MacCready, Jr. was an American aeronautical engineer. He was the founder of AeroVironment and the designer of the human-powered aircraft that won the Kremer prize...
's theory, the optimal speed to fly for best cross country speed may often be considerably in excess of the speed for the best glide angle to get out of the sinking air as quickly as possible.
Glide ratio
The glide ratio is expressed as the ratio of the distance travelled to height lost in the same time; it is expressed as the number of feet (or other length units) traveled horizontally during the time that one foot (or other length unit) of vertical distance is traversed. The ratio of the horizontal speed versus the vertical speed gives the same answer. (If the glider flies at 40 knots for an hour and experiences a 2 knots (4 km/h) sink rate, it will travel 40 nautical mileNautical mile
The nautical mile is a unit of length that is about one minute of arc of latitude along any meridian, but is approximately one minute of arc of longitude only at the equator...
s and descend 2 nautical miles (4 km). The glide ratio is 20 using both methods.
Effect of wind, lift and sink on best glide speed
The effect of wind, lift and sink on best glide speed is to move the curve within the plot by the amount of each component. That is, if flying into a headwind, with no vertical air movement, the curve would move left toward the origin by an amount equal to the velocity of the wind. The effect is the tangent line for best glide speed moves further down the graph for an increasing best glide speed but a lower best glide ratio. Thus, when flying into a head wind, the best glide speed is higher but the best glide ratio is lower. Conversely, for a tail wind, the polar curve moves away from the origin so that best glide speed is lower and the effective glide ratio is improved. In lift, move the curve up for a lower best glide speed and better glide ratio. In sink, move the curve down for a higher best glide speed and a worse glide ratio. The effect is that when flying between thermals, you would slow down in rising air and speed up when encountering sink. Wind with lift/sink would simply move the plot the according amount for each component.Plotting the curve
By measuring the rate of sink at various air-speeds a set of data can be accumulated and plotted on a graph. The points can be connected by a line known as the ‘polar curve’. Each type of glider has a unique polar curve. The curve can be significantly degraded with debris such as bugs, dirt, and rain on the wing. Published polar curves will often be shown for a clean wing in addition to a dirty wing with bug splats represented by small pieces of tape applied to the leading edge of the wing.The origin
Origin (mathematics)
In mathematics, the origin of a Euclidean space is a special point, usually denoted by the letter O, used as a fixed point of reference for the geometry of the surrounding space. In a Cartesian coordinate system, the origin is the point where the axes of the system intersect...
for a polar curve is where the air-speed is zero and the sink rate is zero. In the first diagram a line has been drawn from the origin to the point with minimum sink. The slope of the line from the origin gives the glide angle, because it is the ratio of the distance along the airspeed axis to the distance along the sink rate axis.
A whole series of lines could be drawn from the origin to each of the data points, each line showing the glide angle for that speed. However the best glide angle is the line with the least slope. In the second diagram, the line has been drawn from the origin to the point representing the best glide ratio. The air-speed and sink rate at the best glide ratio can be read off the graph. Note that the best glide ratio is shallower than the glide ratio for minimum sink. All the other lines from the origin to the various data points would be steeper than the line of the best glide angle. Consequently, the line for the best glide angle will only just graze the polar curve, ie it is a tangent
Tangent
In geometry, the tangent line to a plane curve at a given point is the straight line that "just touches" the curve at that point. More precisely, a straight line is said to be a tangent of a curve at a point on the curve if the line passes through the point on the curve and has slope where f...
.
External links
- Glider Performance Airspeeds An animated explanation of the basic polar curve, with modifications for sinking or rising air and for head- or tailwinds.