
Plate notation
Encyclopedia
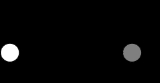
Plate notation is a method of representing variables that repeat in a graphical model
. Instead of drawing each repeated variable individually, a plate or rectangle is used to group variables into a subgraph that repeat together, and a number is drawn on the plate to represent the number of repetitions of the subgraph in the plate. The assumptions are that the subgraph is duplicated that many times, the variables in the subgraph are indexed by the repetition number, and any links that cross a plate boundary are replicated once for each subgraph repetition.
 In this example, we consider Latent Dirichlet allocation
, a Bayesian network
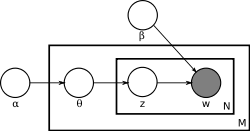
that models how documents in a corpus are topically related. There are two variables not in any plate; α is the parameter of the uniform Dirichlet prior on the per-document topic distributions, and β is the parameter of the uniform Dirichlet prior on the per-topic word distribution.
The outermost plate represents all the variables related to a specific document, including , the topic distribution for document i. The M in the corner of the plate indicates that the variables inside are repeated M times, once for each document. The inner plate represents the variables associated with each of the
  words in document i:
  is the topic for the jth word in document i, and
  is the actual word used.
The N in the corner represents the repetition of the variables in the inner plate times, once for each word in document i. The circle representing the individual words is shaded, indicating that each
  is observable
, and the other circles are empty, indicating that the other variables are latent variable
s. The directed edges between variables indicate dependencies between the variables: for example, each depends on
  and β.
Graphical model
A graphical model is a probabilistic model for which a graph denotes the conditional independence structure between random variables. They are commonly used in probability theory, statistics—particularly Bayesian statistics—and machine learning....
. Instead of drawing each repeated variable individually, a plate or rectangle is used to group variables into a subgraph that repeat together, and a number is drawn on the plate to represent the number of repetitions of the subgraph in the plate. The assumptions are that the subgraph is duplicated that many times, the variables in the subgraph are indexed by the repetition number, and any links that cross a plate boundary are replicated once for each subgraph repetition.
Example
Latent Dirichlet allocation
In statistics, latent Dirichlet allocation is a generative model that allows sets of observations to be explained by unobserved groups that explain why some parts of the data are similar...
, a Bayesian network
Bayesian network
A Bayesian network, Bayes network, belief network or directed acyclic graphical model is a probabilistic graphical model that represents a set of random variables and their conditional dependencies via a directed acyclic graph . For example, a Bayesian network could represent the probabilistic...
that models how documents in a corpus are topically related. There are two variables not in any plate; α is the parameter of the uniform Dirichlet prior on the per-document topic distributions, and β is the parameter of the uniform Dirichlet prior on the per-topic word distribution.
The outermost plate represents all the variables related to a specific document, including
, the topic distribution for document i. The M in the corner of the plate indicates that the variables inside are repeated M times, once for each document. The inner plate represents the variables associated with each of the words in document i: is the topic for the jth word in document i, and is the actual word used.The N in the corner represents the repetition of the variables in the inner plate
times, once for each word in document i. The circle representing the individual words is shaded, indicating that each is observableObservable variable
In statistics, observable variables or manifest variables, as opposed to latent variables, are those variables that can be observed and directly measured.- See also :* Observables in physics* Observability in control theory* Latent variable model...
, and the other circles are empty, indicating that the other variables are latent variable
Latent variable
In statistics, latent variables , are variables that are not directly observed but are rather inferred from other variables that are observed . Mathematical models that aim to explain observed variables in terms of latent variables are called latent variable models...
s. The directed edges between variables indicate dependencies between the variables: for example, each
depends on and β.