
Perceptual mapping
Encyclopedia
Perceptual mapping is a graphics
technique used by asset marketers
that attempts to visually display the perceptions of customers or potential customers. Typically the position
of a product
, product line, brand
, or company is displayed relative to their competition.
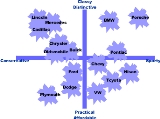
Perceptual maps can have any number of dimensions but the most common is two dimensions. Any more is a challenge to draw and confusing to interpret; POSE Analysis is a new analysis tool which offers an alternative to perceptual mapping by enabling a user to apply multiple dimensions in a radar graph. The first perceptual map below shows consumer perceptions of various automobile
s on the two dimensions of sportiness/conservative and classy/affordable. This sample of consumers felt Porsche
was the sportiest and classiest of the cars in the study (top right corner). They felt Plymouth
was most practical and conservative (bottom left corner).
Cars that are positioned close to each other are seen as similar on the relevant dimensions by the consumer. For example consumers see Buick, Chrysler, and Oldsmobile as similar. They are close competitors and form a competitive grouping. A company considering the introduction of a new model will look for an area on the map free from competitors. Some perceptual maps use different size circles to indicate the sales volume or market share of the various competing products.
Displaying consumers’ perceptions of related products is only half the story. Many perceptual maps also display consumers’ ideal points. These points reflect ideal combinations of the two dimensions as seen by a consumer. The next diagram shows a study of consumers’ ideal points in the alcohol/spirits product space. Each dot represents one respondent's ideal combination of the two dimensions. Areas where there is a cluster of ideal points (such as A) indicates a market segment
. Areas without ideal points are sometimes referred to as demand voids.
A company considering introducing a new product will look for areas with a high density of ideal points. They will also look for areas without competitive rivals. This is best done by placing both the ideal points and the competing products on the same map.
Some maps plot ideal vectors instead of ideal points. The map below, displays various aspirin products as seen on the dimensions of effectiveness and gentleness. It also shows two ideal vectors. The slope of the ideal vector indicates the preferred ratio of the two dimensions by those consumers within that segment. This study indicates there is one segment that is more concerned with effectiveness than harshness, and another segment that is more interested in gentleness than strength.
Perceptual maps need not come from a detailed study. There are also intuitive maps (also called judgmental maps or consensus maps) that are created by marketers based on their understanding of their industry. Management uses its best judgment. It is questionable how valuable this type of map is. Often they just give the appearance of credibility to management’s preconceptions.
When detailed marketing research studies are done methodological problems can arise, but at least the information is coming directly from the consumer. There is an assortment of statistical procedures that can be used to convert the raw data collected in a survey into a perceptual map. Preference regression
will produce ideal vectors. Multi dimensional scaling will produce either ideal points or competitor positions. Factor analysis
, discriminant analysis, cluster analysis
, and logit analysis can also be used. Some techniques are constructed from perceived differences between products, others are constructed from perceived similarities. Still others are constructed from cross price elasticity of demand
data from electronic scanners.
Graphics
Graphics are visual presentations on some surface, such as a wall, canvas, computer screen, paper, or stone to brand, inform, illustrate, or entertain. Examples are photographs, drawings, Line Art, graphs, diagrams, typography, numbers, symbols, geometric designs, maps, engineering drawings,or...
technique used by asset marketers
Marketing
Marketing is the process used to determine what products or services may be of interest to customers, and the strategy to use in sales, communications and business development. It generates the strategy that underlies sales techniques, business communication, and business developments...
that attempts to visually display the perceptions of customers or potential customers. Typically the position
Positioning (marketing)
In marketing, positioning has come to mean the process by which marketers try to create an image or identity in the minds of their target market for its product, brand, or organization....
of a product
Product (business)
In general, the product is defined as a "thing produced by labor or effort" or the "result of an act or a process", and stems from the verb produce, from the Latin prōdūce ' lead or bring forth'. Since 1575, the word "product" has referred to anything produced...
, product line, brand
Brand
The American Marketing Association defines a brand as a "Name, term, design, symbol, or any other feature that identifies one seller's good or service as distinct from those of other sellers."...
, or company is displayed relative to their competition.
Perceptual maps can have any number of dimensions but the most common is two dimensions. Any more is a challenge to draw and confusing to interpret; POSE Analysis is a new analysis tool which offers an alternative to perceptual mapping by enabling a user to apply multiple dimensions in a radar graph. The first perceptual map below shows consumer perceptions of various automobile
Automobile
An automobile, autocar, motor car or car is a wheeled motor vehicle used for transporting passengers, which also carries its own engine or motor...
s on the two dimensions of sportiness/conservative and classy/affordable. This sample of consumers felt Porsche
Porsche
Porsche Automobil Holding SE, usually shortened to Porsche SE a Societas Europaea or European Public Company, is a German based holding company with investments in the automotive industry....
was the sportiest and classiest of the cars in the study (top right corner). They felt Plymouth
Plymouth
Plymouth is a city and unitary authority area on the coast of Devon, England, about south-west of London. It is built between the mouths of the rivers Plym to the east and Tamar to the west, where they join Plymouth Sound...
was most practical and conservative (bottom left corner).
Cars that are positioned close to each other are seen as similar on the relevant dimensions by the consumer. For example consumers see Buick, Chrysler, and Oldsmobile as similar. They are close competitors and form a competitive grouping. A company considering the introduction of a new model will look for an area on the map free from competitors. Some perceptual maps use different size circles to indicate the sales volume or market share of the various competing products.
Displaying consumers’ perceptions of related products is only half the story. Many perceptual maps also display consumers’ ideal points. These points reflect ideal combinations of the two dimensions as seen by a consumer. The next diagram shows a study of consumers’ ideal points in the alcohol/spirits product space. Each dot represents one respondent's ideal combination of the two dimensions. Areas where there is a cluster of ideal points (such as A) indicates a market segment
Market segment
Market segmentation is a concept in economics and marketing. A market segment is a sub-set of a market made up of people or organizations with one or more characteristics that cause them to demand similar product and/or services based on qualities of those products such as price or function...
. Areas without ideal points are sometimes referred to as demand voids.
A company considering introducing a new product will look for areas with a high density of ideal points. They will also look for areas without competitive rivals. This is best done by placing both the ideal points and the competing products on the same map.
Some maps plot ideal vectors instead of ideal points. The map below, displays various aspirin products as seen on the dimensions of effectiveness and gentleness. It also shows two ideal vectors. The slope of the ideal vector indicates the preferred ratio of the two dimensions by those consumers within that segment. This study indicates there is one segment that is more concerned with effectiveness than harshness, and another segment that is more interested in gentleness than strength.
Perceptual maps need not come from a detailed study. There are also intuitive maps (also called judgmental maps or consensus maps) that are created by marketers based on their understanding of their industry. Management uses its best judgment. It is questionable how valuable this type of map is. Often they just give the appearance of credibility to management’s preconceptions.
When detailed marketing research studies are done methodological problems can arise, but at least the information is coming directly from the consumer. There is an assortment of statistical procedures that can be used to convert the raw data collected in a survey into a perceptual map. Preference regression
Preference regression (in marketing)
Preference regression is a statistical technique used by marketers to determine consumers’ preferred core benefits. It usually supplements product positioning techniques like multi dimensional scaling or factor analysis and is used to create ideal vectors on perceptual maps.-Application:Starting...
will produce ideal vectors. Multi dimensional scaling will produce either ideal points or competitor positions. Factor analysis
Factor analysis
Factor analysis is a statistical method used to describe variability among observed, correlated variables in terms of a potentially lower number of unobserved, uncorrelated variables called factors. In other words, it is possible, for example, that variations in three or four observed variables...
, discriminant analysis, cluster analysis
Cluster analysis (in marketing)
Cluster analysis is a class of statistical techniques that can be applied to data that exhibit “natural” groupings. Cluster analysis sorts through the raw data and groups them into clusters. A cluster is a group of relatively homogeneous cases or observations. Objects in a cluster are similar to...
, and logit analysis can also be used. Some techniques are constructed from perceived differences between products, others are constructed from perceived similarities. Still others are constructed from cross price elasticity of demand
Cross elasticity of demand
In economics, the cross elasticity of demand or cross-price elasticity of demand measures the responsiveness of the demand for a good to a change in the price of another good. It is measured as the percentage change in demand for the first good that occurs in response to a percentage change in...
data from electronic scanners.
See also
- marketingMarketingMarketing is the process used to determine what products or services may be of interest to customers, and the strategy to use in sales, communications and business development. It generates the strategy that underlies sales techniques, business communication, and business developments...
- product managementProduct managementProduct management is an organizational lifecycle function within a company dealing with the planning, forecasting, or marketing of a product or products at all stages of the product lifecycle....
- positioningPositioning (marketing)In marketing, positioning has come to mean the process by which marketers try to create an image or identity in the minds of their target market for its product, brand, or organization....
- multi dimensional scaling
- discriminant analysis
- marketing researchMarketing researchMarketing research is "the function that links the consumer, customer, and public to the marketer through information — information used to identify and define marketing opportunities and problems; generate, refine, and evaluate marketing actions; monitor marketing performance; and improve...