
Moody chart
Encyclopedia
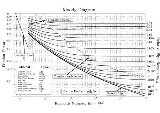
The Moody chart or Moody diagram is a graph in non-dimensional form that relates the Darcy friction factor, Reynolds number and relative roughness for fully developed flow
in a circular pipe. It can be used for working out pressure drop or flow rate down such a pipe.
 (Pa) (or head loss,
  (m)) and flow rate through pipes. Head loss can be calculated using the Darcy–Weisbach equation:

Not to be confused with the Fanning equation:

which uses a friction-factor equal to one fourth the Darcy-Weisbach friction factor. Pressure drop can then be evaluated as:
 or directly from
Where is the density of the fluid,
  is the average velocity in the pipe,
  is the friction factor from the Moody chart,
  is the length of the pipe and
  is the pipe diameter.
The basic chart plots Darcy–Weisbach friction factor
against Reynolds number for a variety of relative roughnesses and flow regimes. The relative roughness being the ratio of the mean height of roughness of the pipe to the pipe diameter or .
.
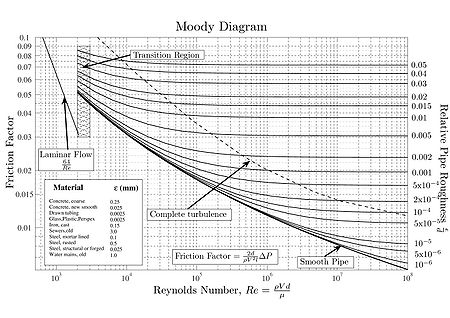 The Moody chart can be divided into two regimes of flow: laminar
and turbulent. For the laminar flow regime, the Darcy–Weisbach friction factor
was determined analytically by Poiseuille and is used. In this regime roughness has no discernible effect. For the turbulent flow regime, the relationship between the friction factor and the Reynolds number is more complex and is governed by the Colebrook equation which is implicit in
  :
:
In 1944, Lewis Ferry Moody
plotted the Darcy–Weisbach friction factor into what is now known as the Moody chart.
The Fanning friction factor is 1/4 the Darcy–Weisbach one and the equation for pressure drop has a compensating factor of four.
Pipe flow
Pipe flow, a branch of Hydraulics and Fluid Mechanics, is a type of liquid flow within a closed conduit . The other type of flow within a conduit being open channel flow....
in a circular pipe. It can be used for working out pressure drop or flow rate down such a pipe.
Description
This dimensionless chart is used to work out pressure drop, (Pa) (or head loss, (m)) and flow rate through pipes. Head loss can be calculated using the Darcy–Weisbach equation:Not to be confused with the Fanning equation:
which uses a friction-factor equal to one fourth the Darcy-Weisbach friction factor. Pressure drop can then be evaluated as:
or directly from Where
is the density of the fluid, is the average velocity in the pipe, is the friction factor from the Moody chart, is the length of the pipe and is the pipe diameter.The basic chart plots Darcy–Weisbach friction factor
Friction factor
Friction factor can refer to:* Darcy friction factor* Fanning friction factor* Atkinson friction factor...
against Reynolds number for a variety of relative roughnesses and flow regimes. The relative roughness being the ratio of the mean height of roughness of the pipe to the pipe diameter or
.Laminar flow
Laminar flow, sometimes known as streamline flow, occurs when a fluid flows in parallel layers, with no disruption between the layers. At low velocities the fluid tends to flow without lateral mixing, and adjacent layers slide past one another like playing cards. There are no cross currents...
and turbulent. For the laminar flow regime, the Darcy–Weisbach friction factor
Friction factor
Friction factor can refer to:* Darcy friction factor* Fanning friction factor* Atkinson friction factor...
was determined analytically by Poiseuille and
is used. In this regime roughness has no discernible effect. For the turbulent flow regime, the relationship between the friction factor and the Reynolds number is more complex and is governed by the Colebrook equation which is implicit in :In 1944, Lewis Ferry Moody
Lewis Ferry Moody
Lewis Ferry Moody 1880 - 1953, was an American engineer and professor and is known for the Moody Diagram, which is in non-dimensional form and relates the friction factor, Reynolds number and relative roughness for fully developed flow in a circular pipe....
plotted the Darcy–Weisbach friction factor into what is now known as the Moody chart.
The Fanning friction factor is 1/4 the Darcy–Weisbach one and the equation for pressure drop has a compensating factor of four.