
Digital image correlation
Encyclopedia
Digital Image Correlation and Tracking (DIC/DDIT) is an optical method that employs tracking & image registration techniques for accurate 2D and 3D measurements of changes in images. This is often used to measure deformation (engineering), displacement
, and strain
, but it is widely applied in many areas of science and engineering. One very common application is for measuring the motion of an optical mouse
.
Early development of DIC was lead by researchers at the University of South Carolina in the early 1980s and has been optimized and improved in recent years. DIC is predicated on the maximization of a correlation coefficient
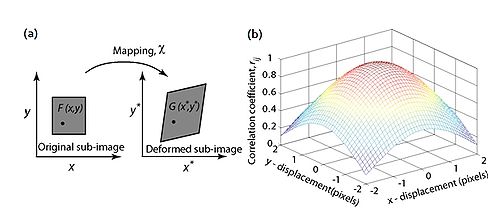
that is determined by examining pixel intensity array subsets on two or more corresponding images and extracting the deformation mapping function that relates the images (Figure 1). An iterative approach is used to minimize the 2D correlation coefficient by using nonlinear optimization techniques. The cross correlation coefficient is defined as
Here F(xi ,yj) is the pixel intensity or the gray scale value at a point (xi ,yj) in the undeformed image. G(xi* ,yj*) is the gray scale value at a point (xi* ,yj*) in the deformed image. and
and  are mean values of the intensity matrices F and G, respectively. The coordinates or grid points (xi ,yj) and (xi* ,yj*) are related by the deformation that occurs between the two images. If the motion is perpendicular to the optical axis of the camera, then the relation between (xi ,yj) and (xi* ,yj*) can be approximated by a 2D affine transformation such as:


Here u and v are translations of the center of the sub-image in the X and Y directions, respectively. The distances from the center of the sub-image to the point (x, y) are denoted by and
and  . Thus, the correlation coefficient rij is a function of displacement components (u, v) and displacement gradients
 .
.
 DIC has proven to be very effective at mapping deformation in macroscopic mechanical testing, where the application of specular markers (e.g. paint, toner powder) or surface finishes from machining and polishing provide the needed contrast to correlate images well. However, these methods for applying surface contrast do not extend to the application of freestanding thin films for several reasons. First, vapor deposition at normal temperatures on semiconductor grade substrates results in mirror-finish quality films with RMS roughnesses that are typically on the order of several nanometers. No subsequent polishing or finishing steps are required, and unless electron imaging techniques are employed that can resolve microstructural features, the films do not possess enough useful surface contrast to adequately correlate images. Typically this challenge can be circumvented by applying paint that results in a random speckle pattern on the surface, although the large and turbulent forces resulting from either spraying or applying paint to the surface of a freestanding thin film are too high and would break the specimens. In addition, the sizes of individual paint particles are on the order of μms, while the film thickness is only several hundred nms, which would be analogous to supporting a large boulder on a thin sheet of paper.
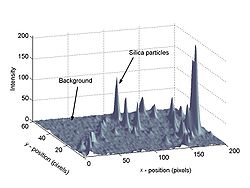
Very recently, advances in pattern application and deposition at reduced length scales have exploited small-scale synthesis methods including nano-scale chemical surface restructuring and photolithography of computer-generated random specular patterns to produce suitable surface contrast for DIC. The application of very fine powder particles that electrostatically adhere to the surface of the specimen and can be digitally tracked is one approach. For Al thin films, fine alumina abrasive polishing powder was initially used since the particle sizes are relatively well controlled, although the adhesion to Al films was not very good and the particles tended to agglomerate excessively. The candidate that worked most effectively was a silica powder designed for a high temperature adhesive compound (Aremco, inc.), which was applied through a plastic syringe. A light blanket of powder would coat the gage section of the tensile sample and the larger particles could be blown away gently. The remaining particles would be those with the best adhesion to the surface, and under low-angle grazing illumination conditions, the specimen gage section would appear as shown in Figure 2. While the surface contrast present is not ideal for DIC, the high intensity ratio between the particles and the background provide a unique opportunity to track the particles between consecutive digital images taken during deformation. This can be achieved quite straightforwardly using digital image processing techniques, although the resolution is always limited to a single pixel. To attain tracking with subpixel resolution, a novel image-based tracking algorithm using MATLAB was developed, dubbed Digital Differential Image Tracking (DDIT), and will be discussed here briefly.
 It is perhaps coincidental that the symmetric normal (Gauss) distribution function proficiently fits the intensity profiles of the particles, although many functions would be suitable as well (e.g., Pearson VII, Cauchy
). This function can also be described in two dimensions.
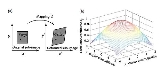
The quality of the Gaussian fit to a peak profile is shown in Figure 3.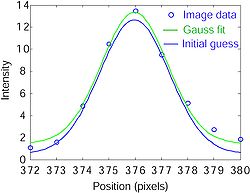 The DDIT script works in the following fashion as schematically shown in Figure 4 (alongside, for comparison, the DIC code, see link, that was also developed). A detailed guide that describes the inner workings of both the DDIT and DIC code can be found below. First, images are captured during the course of a mechanical test. Second, a list of image filenames is generated and the image capture times are extracted from the original images in order to synchronize the DDIT data to that of the data acquisition system. The markers are then automatically detected in the first image (after undergoing automatic background subtraction) by an image processing algorithm that labels connected components in a binary image and subsequently, information regarding the size and shape of these components are extracted (e.g. area, bounding box, centroid, major axis length, minor axis length, etc.). Particles with properties that do not conform to specifications for “ideal” shapes are thrown out, and the remaining markers in the first image are fit to a Gaussian function (in this thesis work) using a nonlinear least-squares algorithm in both the longitudinal and transverse directions. The normalized residuals of the fit of the peak to the function are calculated for every peak (typically several hundred in an image such as Figure 5) and again, fits deemed “poor” as given by the value of the residual are removed from the analysis. This process now continues for every image in the sequence, and the result includes the position of the peak center, which is then post-processed using a visualization and data analysis script that allows visualization and output of the quantities of interest. Incidentally, the DDIT technique has also been successfully applied to the testing of brittle SiO2 and ductile Au thin films.
of these specimens, although the transverse strain resolution obtained using DIC is at the upper limit of what one would desire to measure Poisson’s ratio.
Displacement field (mechanics)
A displacement field is an assignment of displacement vectors for all points in a region or body that is displaced from one state to another. A displacement vector specifies the position of a point or a particle in reference to an origin or to a previous position...
, and strain
Strain (materials science)
In continuum mechanics, the infinitesimal strain theory, sometimes called small deformation theory, small displacement theory, or small displacement-gradient theory, deals with infinitesimal deformations of a continuum body...
, but it is widely applied in many areas of science and engineering. One very common application is for measuring the motion of an optical mouse
Optical mouse
An optical computer mouse or "optic mouse" uses a light-emitting diode and photodiodes to detect movement relative to a surface, unlike a mechanical mouse which has a ball which rotates orthogonal shafts which drive chopper wheels for distance measurement.- Early optical mice :Early optical mice,...
.
Overview
Digital image correlation (DIC) techniques have been increasing in popularity, especially in micro- and nano-scale mechanical testing applications due to its relative ease of implementation and use. Advances in computer technology and digital cameras have been the enabling technologies for this method and while white-light optics has been the predominant approach, DIC can be and has been extended to almost any imaging technology.Early development of DIC was lead by researchers at the University of South Carolina in the early 1980s and has been optimized and improved in recent years. DIC is predicated on the maximization of a correlation coefficient
Correlation
In statistics, dependence refers to any statistical relationship between two random variables or two sets of data. Correlation refers to any of a broad class of statistical relationships involving dependence....
that is determined by examining pixel intensity array subsets on two or more corresponding images and extracting the deformation mapping function that relates the images (Figure 1). An iterative approach is used to minimize the 2D correlation coefficient by using nonlinear optimization techniques. The cross correlation coefficient
is defined asHere F(xi ,yj) is the pixel intensity or the gray scale value at a point (xi ,yj) in the undeformed image. G(xi* ,yj*) is the gray scale value at a point (xi* ,yj*) in the deformed image.
and are mean values of the intensity matrices F and G, respectively. The coordinates or grid points (xi ,yj) and (xi* ,yj*) are related by the deformation that occurs between the two images. If the motion is perpendicular to the optical axis of the camera, then the relation between (xi ,yj) and (xi* ,yj*) can be approximated by a 2D affine transformation such as:Here u and v are translations of the center of the sub-image in the X and Y directions, respectively. The distances from the center of the sub-image to the point (x, y) are denoted by
and . Thus, the correlation coefficient rij is a function of displacement components (u, v) and displacement gradients.Very recently, advances in pattern application and deposition at reduced length scales have exploited small-scale synthesis methods including nano-scale chemical surface restructuring and photolithography of computer-generated random specular patterns to produce suitable surface contrast for DIC. The application of very fine powder particles that electrostatically adhere to the surface of the specimen and can be digitally tracked is one approach. For Al thin films, fine alumina abrasive polishing powder was initially used since the particle sizes are relatively well controlled, although the adhesion to Al films was not very good and the particles tended to agglomerate excessively. The candidate that worked most effectively was a silica powder designed for a high temperature adhesive compound (Aremco, inc.), which was applied through a plastic syringe. A light blanket of powder would coat the gage section of the tensile sample and the larger particles could be blown away gently. The remaining particles would be those with the best adhesion to the surface, and under low-angle grazing illumination conditions, the specimen gage section would appear as shown in Figure 2. While the surface contrast present is not ideal for DIC, the high intensity ratio between the particles and the background provide a unique opportunity to track the particles between consecutive digital images taken during deformation. This can be achieved quite straightforwardly using digital image processing techniques, although the resolution is always limited to a single pixel. To attain tracking with subpixel resolution, a novel image-based tracking algorithm using MATLAB was developed, dubbed Digital Differential Image Tracking (DDIT), and will be discussed here briefly.
Differential Digital Image Tracking (DDIT)
The DDIT method exploits the shape of these powder particles when digitally imaged in the intensity domain as shown in Figure 2. The resemblance of the particles to mathematical functions that are adept at describing peak shapes with precise center locations and broadening (tails) allow them to be fit to a given function and thus tracked.Cauchy distribution
The Cauchy–Lorentz distribution, named after Augustin Cauchy and Hendrik Lorentz, is a continuous probability distribution. As a probability distribution, it is known as the Cauchy distribution, while among physicists, it is known as the Lorentz distribution, Lorentz function, or Breit–Wigner...
). This function can also be described in two dimensions.
The quality of the Gaussian fit to a peak profile is shown in Figure 3.
Resolution of DIC/DDIT
The resolution that one can achieve in practice using these image-based techniques depends on a number of factors, including but not limited to camera resolution, lens optical quality, and marker size and quality. To demonstrate the achievable resolution that one can achieve using the setup and techniques described herein using both DIC and DDIT, a tensile test performed on a brittle linear elastic submicrometre (t ~ 250 nm) freestanding Al-32 at%Mo specimen was analyzed for strain using both methods. This specimen was chosen because it exhibits small strains that are difficult to resolve and also because it is amorphous and thus minimizes any microstructural inhomogeneities. The initial raster grid that was applied for the DIC method and the automatically labeled markers (“good” markers are shown as circles) are shown in Figures 6 and 7, respectively. The representative stress strain response from this film is shown in Figure 8, where both longitudinal (shown in blue) and transverse (shown in green) strains were calculated using DIC with two subset image sizes (15 and 25 pixels) and DDIT. It is apparent from these results that the peak tracking algorithm works quite effectively at resolving the response of this film, even when tracking about 50 times fewer points. The insets of Figure 8 show the typical strain variation that was achieved, where as low as 40 με was observed in the longitudinal direction using DDIT. It was concluded that either of these techniques were effective at measuring the Young’s moduliYoung's modulus
Young's modulus is a measure of the stiffness of an elastic material and is a quantity used to characterize materials. It is defined as the ratio of the uniaxial stress over the uniaxial strain in the range of stress in which Hooke's Law holds. In solid mechanics, the slope of the stress-strain...
of these specimens, although the transverse strain resolution obtained using DIC is at the upper limit of what one would desire to measure Poisson’s ratio.
External links
- XJTUDIC 3D full field deformation and strain measurement system (Chinese and English), China
- XJTUDIC 3D full field deformation and strain measurement system(english), 2D&3D DIC software,China
- Most widely used 3D Image Correlation systems and real world application information, USA
- Industry Standard 3D Image Correlation systems and real world application information, World
- Free 2D DIC software
- free DIC/DDIT functions available for MATLAB
- Mathematica ImageCorrelate function
- Graphical Description of Digital Image Correlation
- Professional Digital Image Correlation system information
- Technique and Application
- DIC for static and dynamic strain and deformation 3D measurement
See also
- Optical flowOptical flowOptical flow or optic flow is the pattern of apparent motion of objects, surfaces, and edges in a visual scene caused by the relative motion between an observer and the scene. The concept of optical flow was first studied in the 1940s and ultimately published by American psychologist James J....
- StressStress (physics)In continuum mechanics, stress is a measure of the internal forces acting within a deformable body. Quantitatively, it is a measure of the average force per unit area of a surface within the body on which internal forces act. These internal forces are a reaction to external forces applied on the body...
- StrainStrain (materials science)In continuum mechanics, the infinitesimal strain theory, sometimes called small deformation theory, small displacement theory, or small displacement-gradient theory, deals with infinitesimal deformations of a continuum body...
- Displacement vectorDisplacement (vector)A displacement is the shortest distance from the initial to the final position of a point P. Thus, it is the length of an imaginary straight path, typically distinct from the path actually travelled by P...
- Particle Image VelocimetryParticle image velocimetryParticle image velocimetry is an optical method of flow visualization used in education and research. It is used to obtain instantaneous velocity measurements and related properties in fluids...