
Detection limit
Encyclopedia
In analytical chemistry
, the detection limit, lower limit of detection, or LOD (limit of detection), is the lowest quantity of a substance that can be distinguished from the absence of that substance (a blank value) within a stated confidence limit
(generally 1%). The detection limit is estimated from the mean
of the blank, the standard deviation
of the blank and some confidence factor. Another consideration that affects the detection limit is the accuracy of the model used to predict concentration from the raw analytical signal.
There are a number of different "detection limits" that are commonly used. These include the instrument detection limit (IDL), the method detection limit (MDL), the practical quantification limit (PQL), and the limit of quantification (LOQ). Even when the same terminology is used, there can be differences in the LOD according to nuances of what definition is used and what type of noise contributes to the measurement and calibration.
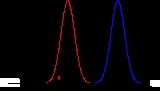
The figure below illustrates the relationship between the blank, the limit of detection (LOD), and the limit of quantification (LOQ) by showing the probability density function for normally distributed measurements at the blank, at the LOD defined as 3 * standard deviation of the blank, and at the LOQ defined as 10 * standard deviation of the blank. For a signal at the LOD, the alpha error (probability of false positive) is small (1%). However, the beta error (probability of a false negative) is 50% for a sample that has a concentration at the LOD (red line). This means a sample could contain an impurity at the LOD, but there is a 50% chance that a measurement would give a result less than the LOD. At the LOQ (blue line), there is minimal chance of a false negative.
without analyte) is analyzed. This signal is referred to as the noise level. The IDL is the analyte concentration that is required to produce a signal greater than three times the standard deviation
of the noise level. This may be practically measured by analyzing 8 or more standards at the estimated IDL then calculating the standard deviation
from the measured concentrations of those standards.
or submitting it to direct analysis. For example it might be necessary to heat a sample that is to be analyzed for a particular metal with the addition of acid first (this is called digestion). The sample may also be diluted or concentrated prior to analysis on an instrument. Additional steps in an analysis add additional opportunities for error. Since detection limits are defined in terms of error, this will naturally increase the measured detection limit. This detection limit (with all steps of the analysis included) is called the MDL. The practical method for determining the MDL is to analyze 7 samples of concentration near the expected limit of detection. The standard deviation
is then determined. The one-sided t distribution
is determined and multiplied versus the determined standard deviation
. For seven samples (with six degrees of freedom) the t value for a 99% confidence interval
is 3.14. Rather than performing the complete analysis of seven identical samples, if the Instrument Detection Limit is known, the MDL may be estimated by multiplying the Instrument Detection Limit or Lower Level of Detection by the dilution prior to analyzing the sample solution on the instrument. This estimation, however, ignores any uncertainty that arises from performing the sample preparation and will therefore probably underestimate the true MDL.
Suppose you are at an airport with lots of noise from jets taking off. If the person next to you speaks softly, you will probably not hear them. Their voice is less than the LOD. If they speak a bit louder, you may hear them but it is not possible to be certain of what they are saying and there is still a good chance you may not hear them. Their voice is >LOD butLOD and >LOQ.
Likewise, their voice may stay at the same loudness, but the noise from jets may be reduced allowing their voice to become >LOD. Detection limits are dependent on both the signal intensity (voice) and the noise (jet noise).
Analytical chemistry
Analytical chemistry is the study of the separation, identification, and quantification of the chemical components of natural and artificial materials. Qualitative analysis gives an indication of the identity of the chemical species in the sample and quantitative analysis determines the amount of...
, the detection limit, lower limit of detection, or LOD (limit of detection), is the lowest quantity of a substance that can be distinguished from the absence of that substance (a blank value) within a stated confidence limit
Confidence interval
In statistics, a confidence interval is a particular kind of interval estimate of a population parameter and is used to indicate the reliability of an estimate. It is an observed interval , in principle different from sample to sample, that frequently includes the parameter of interest, if the...
(generally 1%). The detection limit is estimated from the mean
Mean
In statistics, mean has two related meanings:* the arithmetic mean .* the expected value of a random variable, which is also called the population mean....
of the blank, the standard deviation
Standard deviation
Standard deviation is a widely used measure of variability or diversity used in statistics and probability theory. It shows how much variation or "dispersion" there is from the average...
of the blank and some confidence factor. Another consideration that affects the detection limit is the accuracy of the model used to predict concentration from the raw analytical signal.
There are a number of different "detection limits" that are commonly used. These include the instrument detection limit (IDL), the method detection limit (MDL), the practical quantification limit (PQL), and the limit of quantification (LOQ). Even when the same terminology is used, there can be differences in the LOD according to nuances of what definition is used and what type of noise contributes to the measurement and calibration.
The figure below illustrates the relationship between the blank, the limit of detection (LOD), and the limit of quantification (LOQ) by showing the probability density function for normally distributed measurements at the blank, at the LOD defined as 3 * standard deviation of the blank, and at the LOQ defined as 10 * standard deviation of the blank. For a signal at the LOD, the alpha error (probability of false positive) is small (1%). However, the beta error (probability of a false negative) is 50% for a sample that has a concentration at the LOD (red line). This means a sample could contain an impurity at the LOD, but there is a 50% chance that a measurement would give a result less than the LOD. At the LOQ (blue line), there is minimal chance of a false negative.
Instrument detection limit
Most analytical instruments produce a signal even when a blank (matrixMatrix (chemical analysis)
In chemical analysis, matrix refers to the components of a sample other than the analyte. The matrix can have a considerable effect on the way the analysis is conducted and the quality of the results obtained; such effects are called matrix effects. For example, the ionic strength of the solution...
without analyte) is analyzed. This signal is referred to as the noise level. The IDL is the analyte concentration that is required to produce a signal greater than three times the standard deviation
Standard deviation
Standard deviation is a widely used measure of variability or diversity used in statistics and probability theory. It shows how much variation or "dispersion" there is from the average...
of the noise level. This may be practically measured by analyzing 8 or more standards at the estimated IDL then calculating the standard deviation
Standard deviation
Standard deviation is a widely used measure of variability or diversity used in statistics and probability theory. It shows how much variation or "dispersion" there is from the average...
from the measured concentrations of those standards.
Method detection limit
Many times there is more to the analytical method than just doing a reactionChemical reaction
A chemical reaction is a process that leads to the transformation of one set of chemical substances to another. Chemical reactions can be either spontaneous, requiring no input of energy, or non-spontaneous, typically following the input of some type of energy, such as heat, light or electricity...
or submitting it to direct analysis. For example it might be necessary to heat a sample that is to be analyzed for a particular metal with the addition of acid first (this is called digestion). The sample may also be diluted or concentrated prior to analysis on an instrument. Additional steps in an analysis add additional opportunities for error. Since detection limits are defined in terms of error, this will naturally increase the measured detection limit. This detection limit (with all steps of the analysis included) is called the MDL. The practical method for determining the MDL is to analyze 7 samples of concentration near the expected limit of detection. The standard deviation
Standard deviation
Standard deviation is a widely used measure of variability or diversity used in statistics and probability theory. It shows how much variation or "dispersion" there is from the average...
is then determined. The one-sided t distribution
T distribution
The phrase "T distribution" may refer to* Student's t-test in univariate statistics,* Student's t-distribution in univariate probability theory,* Hotelling's T-square distribution in multivariate statistics.* Multivariate Student distribution....
is determined and multiplied versus the determined standard deviation
Standard deviation
Standard deviation is a widely used measure of variability or diversity used in statistics and probability theory. It shows how much variation or "dispersion" there is from the average...
. For seven samples (with six degrees of freedom) the t value for a 99% confidence interval
Confidence interval
In statistics, a confidence interval is a particular kind of interval estimate of a population parameter and is used to indicate the reliability of an estimate. It is an observed interval , in principle different from sample to sample, that frequently includes the parameter of interest, if the...
is 3.14. Rather than performing the complete analysis of seven identical samples, if the Instrument Detection Limit is known, the MDL may be estimated by multiplying the Instrument Detection Limit or Lower Level of Detection by the dilution prior to analyzing the sample solution on the instrument. This estimation, however, ignores any uncertainty that arises from performing the sample preparation and will therefore probably underestimate the true MDL.
Limit of quantification
Just because we can tell something from noise does not mean that we can necessarily know how much of the material there actually is. The LOQ is the limit at which we can reasonably tell the difference between two different values. The LOQ is drastically different between labs so another detection limit is commonly used that is referred to as the Practical Quantitation Limit (PQL). The PQL is defined simply as about 5 times the MDL.Example
It is often difficult to understand the concept of detection limit. The following example may help to clarify some of the concepts defined above.Suppose you are at an airport with lots of noise from jets taking off. If the person next to you speaks softly, you will probably not hear them. Their voice is less than the LOD. If they speak a bit louder, you may hear them but it is not possible to be certain of what they are saying and there is still a good chance you may not hear them. Their voice is >LOD but
Likewise, their voice may stay at the same loudness, but the noise from jets may be reduced allowing their voice to become >LOD. Detection limits are dependent on both the signal intensity (voice) and the noise (jet noise).