
Demographics of Azerbaijan
Encyclopedia
This article is about the demographic
features of the population
of Azerbaijan
, including population density
, ethnicity
, education level, health of the populace, economic status, religious affiliations and other aspects of the population.
Notes about table
(Azeri) 92.3%, Lezgi 2.2%, Russian
1.8%,
other 3.3%, unspecified 1% (1999 census)
Demographics
Demographics are the most recent statistical characteristics of a population. These types of data are used widely in sociology , public policy, and marketing. Commonly examined demographics include gender, race, age, disabilities, mobility, home ownership, employment status, and even location...
features of the population
Population
A population is all the organisms that both belong to the same group or species and live in the same geographical area. The area that is used to define a sexual population is such that inter-breeding is possible between any pair within the area and more probable than cross-breeding with individuals...
of Azerbaijan
Azerbaijan
Azerbaijan , officially the Republic of Azerbaijan is the largest country in the Caucasus region of Eurasia. Located at the crossroads of Western Asia and Eastern Europe, it is bounded by the Caspian Sea to the east, Russia to the north, Georgia to the northwest, Armenia to the west, and Iran to...
, including population density
Population density
Population density is a measurement of population per unit area or unit volume. It is frequently applied to living organisms, and particularly to humans...
, ethnicity
Ethnic group
An ethnic group is a group of people whose members identify with each other, through a common heritage, often consisting of a common language, a common culture and/or an ideology that stresses common ancestry or endogamy...
, education level, health of the populace, economic status, religious affiliations and other aspects of the population.
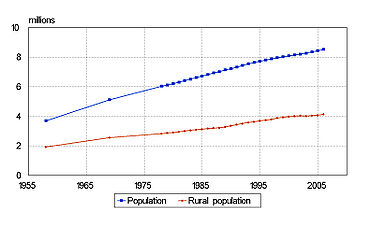
Total population (in thousands)
| Year | 1897 | 1908 | 1917 | 1920 | 1923 | 1930 | 1940 | 1941 | 1942 | 1943 | 1944 | 1945 | 1946 | 1947 | 1948 | 1949 | 1950 | 1960 | 1970 | 1980 | 1990 | 2000 | 2009 | 2010 | |
|---|---|---|---|---|---|---|---|---|---|---|---|---|---|---|---|---|---|---|---|---|---|---|---|---|---|
| City | 305.1 | - | 560.2 | 405.8 | 486.0 | 750.9 | 1212.0 | 1239.8 | 1195.5 | 1138.1 | 1105.8 | 1118.5 | 1159.9 | 1163.1 | 1110.1 | 1149.1 | 1252.3 | 1835.2 | 2564.6 | 3247.5 | 3847.3 | 4116.4 | 4818.7 | - | |
| Rural | 1501.6 | - | 1793.5 | 1546.4 | 1377.0 | 1818.6 | 2062.0 | 2092.0 | 1961.6 | 1780.0 | 1670.9 | 1587.1 | 1574.6 | 1577.4 | 1589.2 | 1583.5 | 1606.6 | 1980.5 | 2552.5 | 2866.8 | 3284.6 | 3916.4 | 4078.6 | - | |
| Total | 1806.7 | 2014.3 | 2353.7 | 1952.2 | 1863.0 | 2569.5 | 3274.0 | 3331.8 | 3157.1 | 2918.1 | 2776.7 | 2705.6 | 2734.5 | 2740.5 | 2699.3 | 2732.6 | 2858.9 | 3815.7 | 5117.1 | 6114.3 | 7131.9 | 8032.8 | 8896.9 | 9000.0. | |
Notes about table
- To see the effect of periodical events on the population period until 1950 is not given in decades.
- 9,047,000 (2010)
Vital statistics
| Average population (x 1000) | Live births | Deaths | Natural change | Crude birth rate (per 1000) | Crude death rate (per 1000) | Natural change (per 1000) | |
|---|---|---|---|---|---|---|---|
| 1960 | 3 895 | 165 849 | 25 918 | 139 931 | 42.6 | 6.7 | 35.9 |
| 1961 | 4 026 | 170 504 | 27 295 | 143 209 | 42.4 | 6.8 | 35.6 |
| 1962 | 4 163 | 168 341 | 30 901 | 137 440 | 40.4 | 7.4 | 33.0 |
| 1963 | 4 303 | 175 033 | 30 230 | 144 803 | 40.7 | 7.0 | 33.7 |
| 1964 | 4 441 | 176 546 | 31 841 | 144 705 | 39.8 | 7.2 | 32.6 |
| 1965 | 4 575 | 167 429 | 29 095 | 138 334 | 36.6 | 6.4 | 30.2 |
| 1966 | 4 703 | 166 545 | 31 657 | 134 888 | 35.4 | 6.7 | 28.7 |
| 1967 | 4 826 | 157 270 | 32 338 | 124 932 | 32.6 | 6.7 | 25.9 |
| 1968 | 4 945 | 158 962 | 32 950 | 126 012 | 32.1 | 6.7 | 25.4 |
| 1969 | 5 060 | 148 078 | 35 428 | 112 650 | 29.3 | 7.0 | 22.3 |
| 1970 | 5 172 | 150 976 | 34 506 | 116 470 | 29.2 | 6.7 | 22.5 |
| 1971 | 5 281 | 146 261 | 34 236 | 112 025 | 27.7 | 6.5 | 21.2 |
| 1972 | 5 387 | 137 752 | 35 658 | 102 094 | 25.6 | 6.6 | 19.0 |
| 1973 | 5 491 | 138 569 | 34 770 | 103 799 | 25.2 | 6.3 | 18.9 |
| 1974 | 5 591 | 139 084 | 36 082 | 103 002 | 24.9 | 6.5 | 18.4 |
| 1975 | 5 689 | 141 857 | 39 291 | 102 566 | 24.9 | 6.9 | 18.0 |
| 1976 | 5 784 | 147 199 | 38 029 | 109 170 | 25.4 | 6.6 | 18.8 |
| 1977 | 5 878 | 146 822 | 39 035 | 107 787 | 25.0 | 6.6 | 18.4 |
| 1978 | 5 970 | 148 812 | 39 936 | 108 876 | 24.9 | 6.7 | 18.2 |
| 1979 | 6 028 | 153 080 | 43 022 | 110 058 | 25.4 | 7.1 | 18.3 |
| 1980 | 6 161 | 154 974 | 43 064 | 111 910 | 25.2 | 7.0 | 18.2 |
| 1981 | 6 260 | 164 577 | 42 898 | 121 679 | 26.3 | 6.9 | 19.4 |
| 1982 | 6 351 | 160 425 | 42 376 | 118 049 | 25.3 | 6.7 | 18.6 |
| 1983 | 6 453 | 168 644 | 42 944 | 125 700 | 26.1 | 6.7 | 19.5 |
| 1984 | 6 560 | 174 437 | 44 845 | 129 592 | 26.6 | 6.8 | 19.8 |
| 1985 | 6 661 | 177 657 | 45 179 | 132 478 | 26.7 | 6.8 | 19.9 |
| 1986 | 6 760 | 186 609 | 45 344 | 141 265 | 27.6 | 6.7 | 20.9 |
| 1987 | 6 866 | 184 585 | 45 744 | 138 841 | 26.9 | 6.7 | 20.2 |
| 1988 | 6 980 | 184 350 | 47 485 | 136 865 | 26.4 | 6.8 | 19.6 |
| 1989 | 7 085 | 181 631 | 44 016 | 137 615 | 25.6 | 6.2 | 19.4 |
| 1990 | 7 153 | 182 989 | 42 819 | 140 170 | 25.6 | 6.0 | 19.6 |
| 1991 | 7 271 | 190 353 | 44 659 | 145 694 | 26.2 | 6.1 | 20.0 |
| 1992 | 7 382 | 181 361 | 51 258 | 130 103 | 24.6 | 6.9 | 17.6 |
| 1993 | 7 495 | 174 618 | 52 809 | 121 809 | 23.3 | 7.0 | 16.3 |
| 1994 | 7 597 | 159 761 | 54 921 | 104 840 | 21.0 | 7.2 | 13.8 |
| 1995 | 7 685 | 143 315 | 50 828 | 92 487 | 18.6 | 6.6 | 12.0 |
| 1996 | 7 763 | 129 247 | 48 242 | 81 005 | 16.6 | 6.2 | 10.4 |
| 1997 | 7 838 | 132 052 | 46 962 | 85 090 | 16.8 | 6.0 | 10.9 |
| 1998 | 7 915 | 123 996 | 46 299 | 77 697 | 15.7 | 5.8 | 9.8 |
| 1999 | 7 985 | 117 539 | 46 295 | 71 244 | 14.7 | 5.8 | 8.9 |
| 2000 | 8 074 | 116 994 | 46 701 | 70 293 | 14.5 | 5.8 | 8.7 |
| 2001 | 8 153 | 110 356 | 45 284 | 65 072 | 13.5 | 5.6 | 8.0 |
| 2002 | 8 230 | 110 715 | 46 522 | 64 193 | 13.5 | 5.7 | 7.8 |
| 2003 | 8 309 | 113 467 | 49 001 | 64 466 | 13.7 | 5.9 | 7.8 |
| 2004 | 8 398 | 131 609 | 49 568 | 82 041 | 15.7 | 5.9 | 9.8 |
| 2005 | 8 500 | 141 901 | 51 962 | 89 939 | 16.7 | 6.1 | 10.6 |
| 2006 | 8 609 | 148 946 | 52 248 | 96 698 | 17.3 | 6.1 | 11.2 |
| 2007 | 8 723 | 151 963 | 53 655 | 98 308 | 17.4 | 6.2 | 11.3 |
| 2008 | 8 838 | 152 086 | 52 710 | 99 376 | 17.2 | 6.0 | 11.3 |
| 2009 | 8 947 | 152 139 | 52 514 | 99 625 | 17.0 | 5.9 | 11.1 |
| 2010 | 165 643 | 53 580 | 112 063 | 18.5 | 6.0 | 12.5 |
Ethnic groups
| Ethnic group |
census 19261 | census 19392 | census 19593 | census 19704 | census 19795 | census 19896 | census 19996 | census 2009 | ||||||||
|---|---|---|---|---|---|---|---|---|---|---|---|---|---|---|---|---|
| Number | % | Number | % | Number | % | Number | % | Number | % | Number | % | Number | % | Number | % | |
| Azerbaijanis | 1,437,977 | 62.1 | 1,870,471 | 58.4 | 2,494,381 | 67.5 | 3,776,778 | 73.8 | 4,708,832 | 78.1 | 5,804,980 | 82.7 | 7,205,464 | 90.6 | 8,172,800 | 91.6 |
| Lezgins Lezgins The Lezgians are an ethnic group living predominantly in southern Dagestan and northeastern Azerbaijan and who speak the Lezgian language.- Historical concept :While ancient Greek historians, including Herodotus, Strabo, and Pliny the Elder, referred... |
37,263 | 1.6 | 111,666 | 3.5 | 98,211 | 2.7 | 137,250 | 2.7 | 158,057 | 2.6 | 171,395 | 2.4 | 178,021 | 2.2 | 180,300 | 2.02 |
| Russians Russians The Russian people are an East Slavic ethnic group native to Russia, speaking the Russian language and primarily living in Russia and neighboring countries.... |
220,545 | 9.5 | 528,318 | 16.5 | 501,282 | 13.6 | 510,059 | 10.0 | 475,255 | 7.9 | 392,304 | 5.6 | 141,687 | 1.8 | 119,300 | 1.35 |
| Armenians Armenians Armenian people or Armenians are a nation and ethnic group native to the Armenian Highland.The largest concentration is in Armenia having a nearly-homogeneous population with 97.9% or 3,145,354 being ethnic Armenian.... |
282,004 | 12.2 | 388,025 | 12.1 | 442,089 | 12.0 | 483,520 | 9.4 | 475,486 | 7.9 | 390,505 | 5.6 | 120,7458 | 1.5 | 120,3008 | 1.35 |
| Talysh Talysh Talysh may refer to:*Talysh people*Talysh language*Talysh Khanate*Talysh-Mughan Autonomous Republic - a self-declared autonomy, which existed briefly in the south of Azerbaijan in 1993*Talysh Mountains*Talış, Agsu, Azerbaijan*Talış, Hajigabul, Azerbaijan... |
77,323 | 3.3 | 87,510 | 2.7 | 85 | 0.0 | 21,169 | 0.3 | 76,841 | 1.0 | 112,000 | 1.26 | ||||
| Avars Avars Avar or Avars may refer to:* Eurasian Avars, a nomadic people that conquered the Hungarian Steppe in the early Middle Ages* Uar * Caucasian Avars, a modern people of the Caucasus** Avar language, the language of the Caucasian Avars... |
19,104 | 0.8 | 15,740 | 0.5 | 17,254 | 0.5 | 30,735 | 0.6 | 35,991 | 0.6 | 44,072 | 0.6 | 50,871 | 0.6 | 49,800 | 0.56 |
| Turks | 95 | 0.0 | 600 | 0.0 | 202 | 0.0 | 8,491 | 0.2 | 7,926 | 0.1 | 17,705 | 0.3 | 43,454 | 0.5 | 38,000 | 0,43 |
| Tatars Tatars Tatars are a Turkic speaking ethnic group , numbering roughly 7 million.The majority of Tatars live in the Russian Federation, with a population of around 5.5 million, about 2 million of which in the republic of Tatarstan.Significant minority populations are found in Uzbekistan, Kazakhstan,... |
9,948 | 0.4 | 27,591 | 0.9 | 29,370 | 0.8 | 31,353 | 0.6 | 31,204 | 0.5 | 28,019 | 0.4 | 30,011 | 0.4 | 25,900 | 0,29 |
| Ukrainians Ukrainians Ukrainians are an East Slavic ethnic group native to Ukraine, which is the sixth-largest nation in Europe. The Constitution of Ukraine applies the term 'Ukrainians' to all its citizens... |
18,241 | 0.8 | 23,643 | 0.7 | 25,778 | 0.7 | 29,160 | 0.6 | 26,402 | 0.4 | 32,345 | 0.5 | 28,984 | 0.4 | 21,500 | 0,24 |
| Tsakhurs | 15,552 | 0.7 | 6,464 | 0.2 | 2,876 | 0.1 | 6,208 | 0.1 | 8,546 | 0.1 | 13,318 | 0.2 | 15,877 | 0.2 | 12,300 | 0.14 |
| Udins | 2,445 | 0.1 | 3,202 | 0.1 | 5,492 | 0.1 | 5,841 | 0.1 | 6,125 | 0.1 | 4,152 | 0.1 | 3,800 | 0.04 | ||
| Georgians Georgians The Georgians are an ethnic group that have originated in Georgia, where they constitute a majority of the population. Large Georgian communities are also present throughout Russia, European Union, United States, and South America.... |
9,500 | 0.4 | 10,196 | 0.3 | 9,526 | 0.3 | 13,595 | 0.3 | 11,412 | 0.2 | 14,197 | 0.2 | 14,877 | 0.2 | 9,900 | 0.11 |
| Kurds | 41,1937 | 1.8 | 6,005 | 0.2 | 1,487 | 0.0 | 5,488 | 0.1 | 5,676 | 0.1 | 12,226 | 0.2 | 13,075 | 0.2 | 6,100 | 0.07 |
| Tat Tat Tat or TAT may refer to:in ethnology:* Tats, an Iranian ethnic group from the Caucasus* Tat language , their language* Juhuri language, the Jewish Tat language* Tati language , a group of northwestern Iranian dialects... |
28,443 | 1.2 | 2,289 | 0.1 | 5,887 | 0.2 | 7,769 | 0.2 | 8,848 | 0.1 | 10,239 | 0.1 | 10,922 | 0.1 | 25,200 | 0.28 |
| Jews Jews The Jews , also known as the Jewish people, are a nation and ethnoreligious group originating in the Israelites or Hebrews of the Ancient Near East. The Jewish ethnicity, nationality, and religion are strongly interrelated, as Judaism is the traditional faith of the Jewish nation... |
20,578 | 0.9 | 41,245 | 1.3 | 40,198 | 1.1 | 48,652 | 1.0 | 35,487 | 0.6 | 30,792 | 0.4 | 8,916 | 0.1 | 9,100 | 0.1 |
| Others | 94,360 | 4.1 | 85,387 | 2.7 | 25,889 | 0.7 | 22,531 | 0.4 | 31,552 | 0.5 | 31,787 | 0.5 | 9,541 | 0.1 | 9,500 | 0.11 |
| Total | 2,314,571 | 3,205,150 | 3,697,717 | 5,117,081 | 6,026,515 | 7,021,178 | 7,953,438 | 8,922,400 | ||||||||
| 1 Source: http://demoscope.ru/weekly/ssp/sng_nac_26.php?reg=2275. 2 Source: http://demoscope.ru/weekly/ssp/sng_nac_39.php. 3 Source: http://demoscope.ru/weekly/ssp/sng_nac_59.php. 4 Source: http://demoscope.ru/weekly/ssp/sng_nac_70.php. 5 Source: http://demoscope.ru/weekly/ssp/sng_nac_79.php. 6 Source: http://demoscope.ru/weekly/ssp/sng_nac_89.php. 7 Almost all Kurds lived in Kurdistan Uyezd, the territory between Armenia Armenia Armenia , officially the Republic of Armenia , is a landlocked mountainous country in the Caucasus region of Eurasia... and Nagorno Karabach. In the late 1930s Soviet authorities deported most of the Kurdish population of Azerbaijan to Kazakhstan. 8 Almost all Armenians Armenians Armenian people or Armenians are a nation and ethnic group native to the Armenian Highland.The largest concentration is in Armenia having a nearly-homogeneous population with 97.9% or 3,145,354 being ethnic Armenian.... live in the break-away region of Nagorno Karabach since the early 1990s. |
||||||||||||||||
Languages
AzerbaijaniAzerbaijani language
Azerbaijani or Azeri or Torki is a language belonging to the Turkic language family, spoken in southwestern Asia by the Azerbaijani people, primarily in Azerbaijan and northwestern Iran...
(Azeri) 92.3%, Lezgi 2.2%, Russian
Russian language
Russian is a Slavic language used primarily in Russia, Belarus, Uzbekistan, Kazakhstan, Tajikistan and Kyrgyzstan. It is an unofficial but widely spoken language in Ukraine, Moldova, Latvia, Turkmenistan and Estonia and, to a lesser extent, the other countries that were once constituent republics...
1.8%,
other 3.3%, unspecified 1% (1999 census)
Demographic statistics
The following demographic statistics are from the CIA World Factbook, unless otherwise indicated.Age structure
- 0-14 years: 25.8% (male 1,046,501/female 1,011,492)
- 15-64 years: 66.3% (male 2,573,134/female 2,706,275)
- 65 years and over: 7.8% (male 246,556/female 377,661) (2006 est.)
Urbanization
- Urban population: 52% of total population (2008)
- Rate of urbanization: 1% of annual rate of change (2005-10 est.)
Sex ratio
- At birth: 1.13 male(s)/female
- Under 15 years: 1.12 male(s)/female
- 15-64 years: 0.96 male(s)/female
- 65 years and over: 0.58 male(s)/female
- Total population: 0.97 male(s)/female (2009 est.)
Life expectancy at birth
- Total population: 66.66 years
- country comparison to the world: 158
- Male: 62.53 years
- Female: 71.34 years (2009 est.)
Total fertility rate
- 2.04 children born/woman (2009 est.)
- country comparison to the world: 126
HIV/AIDS
- Adult prevalence rate: less than 0.2% (2007 est.)
- country comparison to the world: 92
- People living with HIV/AIDS: 7,800 (2007 est.)
- country comparison to the world: 113
- Deaths: less than 100 (2007 est.)
- country comparison to the world: 127
Religions
- IslamIslamIslam . The most common are and . : Arabic pronunciation varies regionally. The first vowel ranges from ~~. The second vowel ranges from ~~~...
(of which majority Shi'a IslamShi'a IslamShia Islam is the second largest denomination of Islam. The followers of Shia Islam are called Shi'ites or Shias. "Shia" is the short form of the historic phrase Shīʻatu ʻAlī , meaning "followers of Ali", "faction of Ali", or "party of Ali".Like other schools of thought in Islam, Shia Islam is...
) 93.4% - Russian Orthodox ChurchRussian Orthodox ChurchThe Russian Orthodox Church or, alternatively, the Moscow Patriarchate The ROC is often said to be the largest of the Eastern Orthodox churches in the world; including all the autocephalous churches under its umbrella, its adherents number over 150 million worldwide—about half of the 300 million...
2.5% - Georgian Orthodox Church 0.18%
- JudaismJudaismJudaism ) is the "religion, philosophy, and way of life" of the Jewish people...
(incl. Mountain JewsMountain JewsHighland Jews, Mountain Jews or Kavkazi Jews also known as Juvuro or Juhuro, are Jews of the eastern Caucasus, mainly of Azerbaijan and Dagestan. They are also known as Caucasus Jews, Caucasian Jews, or less commonly East Caucasian Jews, because the majority of these Jews settled the eastern part...
) 0.11%
- Note: Religious affiliation is still nominal in Azerbaijan; percentages for actual practicing adherents are much lower
Literacy
- Definition: age 15 and over can read and write
- Total population: 98.8%
- Male: 99.5%
- Female: 98.2% (2003 est.)