
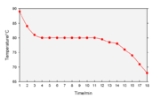
Cooling curve
Overview
Graphics
Graphics are visual presentations on some surface, such as a wall, canvas, computer screen, paper, or stone to brand, inform, illustrate, or entertain. Examples are photographs, drawings, Line Art, graphs, diagrams, typography, numbers, symbols, geometric designs, maps, engineering drawings,or...
that represents the change of phase
Phase (matter)
In the physical sciences, a phase is a region of space , throughout which all physical properties of a material are essentially uniform. Examples of physical properties include density, index of refraction, and chemical composition...
of matter
Matter
Matter is a general term for the substance of which all physical objects consist. Typically, matter includes atoms and other particles which have mass. A common way of defining matter is as anything that has mass and occupies volume...
, typically from a gas to a solid or a liquid to a solid. The independent variable
Independent variable
The terms "dependent variable" and "independent variable" are used in similar but subtly different ways in mathematics and statistics as part of the standard terminology in those subjects...
(X-axis) is time and the dependent variable (Y-axis) is temperature. Below is an example of a cooling curve used in casting
Casting
In metalworking, casting involves pouring liquid metal into a mold, which contains a hollow cavity of the desired shape, and then allowing it to cool and solidify. The solidified part is also known as a casting, which is ejected or broken out of the mold to complete the process...
s.
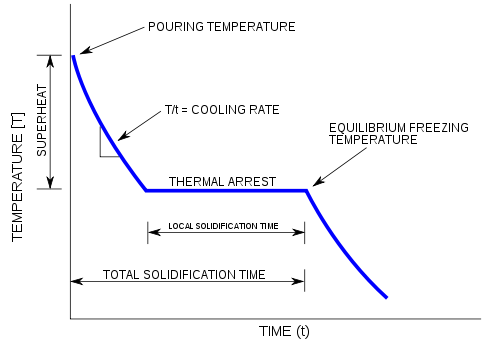
The initial point of the graph is the starting temperature of the matter, here noted as the "pouring temperature".
Unanswered Questions