

Bollinger bands
Encyclopedia
Technical analysis
In finance, technical analysis is security analysis discipline for forecasting the direction of prices through the study of past market data, primarily price and volume. Behavioral economics and quantitative analysis incorporate technical analysis, which being an aspect of active management stands...
tools invented by John Bollinger
John Bollinger
John A. Bollinger is an American author, financial analyst, contributor to the field of technical analysis and the developer of Bollinger Bands. His book Bollinger on Bollinger Bands, John Bollinger, McGraw Hill, 2002, ISBN 978-0-07-137368-5, has been translated into eight languages.Chinese ,...
in the 1980s. Having evolved from the concept of trading bands, Bollinger Bands can be used to measure the highness or lowness of the price relative to previous trades.
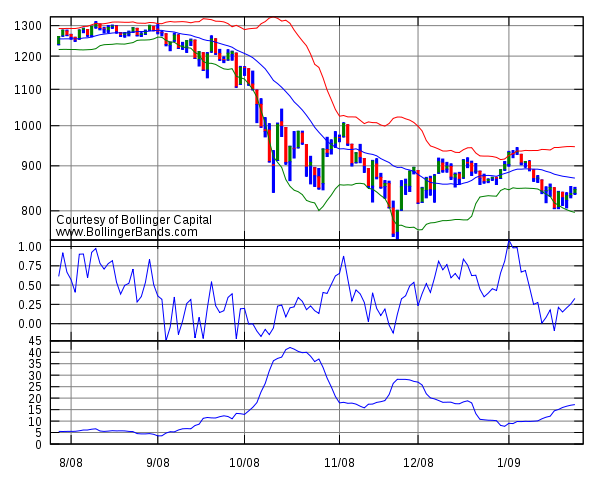
Bollinger Bands consist of:
- an N-period moving average (MA)
- an upper band at K times an N-period standard deviationStandard deviationStandard deviation is a widely used measure of variability or diversity used in statistics and probability theory. It shows how much variation or "dispersion" there is from the average...
above the moving average (MA + Kσ) - a lower band at K times an N-period standard deviationStandard deviationStandard deviation is a widely used measure of variability or diversity used in statistics and probability theory. It shows how much variation or "dispersion" there is from the average...
below the moving average (MA − Kσ)
Typical values for N and K are 20 and 2, respectively. The default choice for the average is a simple moving average, but other types of averages can be employed as needed. Exponential moving averages are a common second choice. Usually the same period is used for both the middle band and the calculation of standard deviation.Bollinger Bands use the population method of calculating standard deviation, thus the proper divisor for the sigma calculation is n, not n − 1.
Purpose
The purpose of Bollinger Bands is to provide a relative definition of high and low. By definition, prices are high at the upper band and low at the lower band. This definition can aid in rigorous pattern recognitionPattern recognition
In machine learning, pattern recognition is the assignment of some sort of output value to a given input value , according to some specific algorithm. An example of pattern recognition is classification, which attempts to assign each input value to one of a given set of classes...
and is useful in comparing price action to the action of indicators to arrive at systematic trading decisions.
Indicators derived from Bollinger Bands
There are two indicators derived from Bollinger Bands, %b and BandWidth.%b, pronounced 'percent b', is derived from the formula for Stochastics
Stochastic oscillator
In technical analysis of securities trading, the stochastic oscillator is a momentum indicator that uses support and resistance levels. Dr. George Lane promoted this indicator in the 1950s. The term stochastic refers to the location of a current price in relation to its price range over a period...
and tells you where you are in relation to the bands. %b equals 1 at the upper band and 0 at the lower band. Writing upperBB for the upper Bollinger Band, lowerBB for the lower Bollinger Band, and last for the last (price) value:
- %b = (last − lowerBB) / (upperBB − lowerBB)
BandWidth tells you how wide the Bollinger Bands are on a normalized basis. Writing the same symbols as before, and middleBB for the moving average, or middle Bollinger Band:
- BandWidth = (upperBB − lowerBB) / middleBB
Using the default parameters of a 20-period look back and plus/minus two standard deviations, BandWidth is equal to four times the 20-period coefficient of variation
Coefficient of variation
In probability theory and statistics, the coefficient of variation is a normalized measure of dispersion of a probability distribution. It is also known as unitized risk or the variation coefficient. The absolute value of the CV is sometimes known as relative standard deviation , which is...
.
Uses for %b include system building and pattern recognition
Pattern recognition
In machine learning, pattern recognition is the assignment of some sort of output value to a given input value , according to some specific algorithm. An example of pattern recognition is classification, which attempts to assign each input value to one of a given set of classes...
. Uses for BandWidth include identification of opportunities arising from relative extremes in volatility
Volatility (finance)
In finance, volatility is a measure for variation of price of a financial instrument over time. Historic volatility is derived from time series of past market prices...
and trend identification.
In a series of lectures at The World Money Show in Hong Kong, Asian Traders Investment Conference in Singapore, the Italian Trading Forum in Rimini, Italy, The European Technical Analysis Conference in London, England and the Market Technicians Symposium in New York, USA, all in Spring of 2010, John Bollinger
John Bollinger
John A. Bollinger is an American author, financial analyst, contributor to the field of technical analysis and the developer of Bollinger Bands. His book Bollinger on Bollinger Bands, John Bollinger, McGraw Hill, 2002, ISBN 978-0-07-137368-5, has been translated into eight languages.Chinese ,...
introduced three new indicators based on Bollinger Bands. They are BB Impulse, which measures price change as a function of the bands, BandWidth Percent, which normalizes the width of the bands over time, and BandWidth Delta, which quantifies the changing width of the bands.
Interpretation
The use of Bollinger Bands varies widely among traders. Some traders buy when price touches the lower Bollinger Band and exit when price touches the moving average in the center of the bands. Other traders buy when price breaks above the upper Bollinger Band or sell when price falls below the lower Bollinger Band. Moreover, the use of Bollinger Bands is not confined to stock traders; optionOption (finance)
In finance, an option is a derivative financial instrument that specifies a contract between two parties for a future transaction on an asset at a reference price. The buyer of the option gains the right, but not the obligation, to engage in that transaction, while the seller incurs the...
s traders, most notably implied volatility
Implied volatility
In financial mathematics, the implied volatility of an option contract is the volatility of the price of the underlying security that is implied by the market price of the option based on an option pricing model. In other words, it is the volatility that, when used in a particular pricing model,...
traders, often sell options when Bollinger Bands are historically far apart or buy options when the Bollinger Bands are historically close together, in both instances, expecting volatility to revert back towards the average historical volatility level for the stock.
When the bands lie close together a period of low volatility
Volatility (finance)
In finance, volatility is a measure for variation of price of a financial instrument over time. Historic volatility is derived from time series of past market prices...
in stock price is indicated. When they are far apart a period of high volatility in price is indicated. When the bands have only a slight slope and lie approximately parallel for an extended time the price of a stock will be found to oscillate up and down between the bands as though in a channel.
Traders are often inclined to use Bollinger Bands with other indicators to see if there is confirmation. In particular, the use of an oscillator like Bollinger Bands will often be coupled with a non-oscillator indicator like chart patterns
Chart patterns
A chart pattern is a pattern that is formed within a chart when prices are graphed. In stock and commodity markets trading, chart pattern studies play a large role during technical analysis. When data is plotted there is usually a pattern which naturally occurs and repeats over a period of time...
or a trendline; if these indicators confirm the recommendation of the Bollinger Bands, the trader will have greater evidence that what the bands forecast is correct.
Effectiveness
A recent study concluded that Bollinger Band trading strategies may be effective in the Chinese marketplace, stating: "Finally, we find significant positive returns on buy trades generated by the contrarian version of the moving-average crossover rule, the channel breakout rule, and the Bollinger Band trading rule, after accounting for transaction costs of 0.50 percent." Nauzer J. Balsara, Gary Chen and Lin Zheng The Chinese Stock Market: An Examination of the Random Walk Model and Technical Trading Rules. (By "the contrarian version", they mean buying when the conventional rule mandates selling, and vice versa.)A paper by Rostan, Pierre, Théoret, Raymond and El moussadek, Abdeljalil from 2008 at SSRN uses Bollinger Bands in forecasting the yield curve
Yield curve
In finance, the yield curve is the relation between the interest rate and the time to maturity, known as the "term", of the debt for a given borrower in a given currency. For example, the U.S. dollar interest rates paid on U.S...
.
Companies like Forbes
Forbes
Forbes is an American publishing and media company. Its flagship publication, the Forbes magazine, is published biweekly. Its primary competitors in the national business magazine category are Fortune, which is also published biweekly, and Business Week...
suggest that the use of Bollinger Bands is a simple and often an effective strategy but stop-loss orders should be used to mitigate losses from market pressure.
Statistical properties
Security prices have no known statistical distribution, normal or otherwise; they are known to have fat tailFat tail
A fat-tailed distribution is a probability distribution that has the property, along with the heavy-tailed distributions, that they exhibit extremely large skewness or kurtosis. This comparison is often made relative to the ubiquitous normal distribution, which itself is an example of an...
s, compared to the Normal. The sample size
Sample size
Sample size determination is the act of choosing the number of observations to include in a statistical sample. The sample size is an important feature of any empirical study in which the goal is to make inferences about a population from a sample...
typically used, 20, is too small for conclusions derived from statistical techniques like the Central Limit Theorem
Central limit theorem
In probability theory, the central limit theorem states conditions under which the mean of a sufficiently large number of independent random variables, each with finite mean and variance, will be approximately normally distributed. The central limit theorem has a number of variants. In its common...
to be reliable. Such techniques usually require the sample to be independent and identically distributed which is not the case for a time series
Time series
In statistics, signal processing, econometrics and mathematical finance, a time series is a sequence of data points, measured typically at successive times spaced at uniform time intervals. Examples of time series are the daily closing value of the Dow Jones index or the annual flow volume of the...
like security prices.
For these three primary reasons, it is incorrect to assume that the percentage of the data outside the Bollinger Bands will always be limited to a certain amount. So, instead of finding about 95% of the data inside the bands, as would be the expectation with the default parameters if the data were normally distributed, one will typically find less; how much less is a function of the security's volatility.
Bollinger Bands outside of finance
In a paper published in 2006 by the Society of Photo-Optical Engineers, "Novel method for patterned fabric inspection using Bollinger Bands", Henry Y. T. Ngan and Grantham K. H. Pang present a method of using Bollinger Bands to detect defects in patterned fabrics. From the abstract: "In this paper, the upper band and lower band of Bollinger Bands, which are sensitive to any subtle change in the input data, have been developed for use to indicate the defective areas in patterned fabric."The International Civil Aviation Organization is using Bollinger Bands to measure the accident rate as a safety indicator to measure efficiency of global safety initiatives. %b and BandWidth are also used in this analysis.
Further reading
- Achelis, Steve. Technical Analysis from A to Z (pp. 71–73). Irwin, 1995. ISBN 978-0-07-136348-8
- Bollinger, John. Bollinger on Bollinger Bands. McGraw Hill, 2002. ISBN 978-0-07-137368-5
- Cahen, Philippe. Dynamic Technical Analysis. Wiley, 2001. ISBN 978-0-471-89947-1
- Kirkpatrick, Charles D. II; Dahlquist, Julie R. Technical Analysis: The Complete Resource for Financial Market Technicians, FT Press, 2006. ISBN 0-13-153113-1
- Murphy, John J. Technical Analysis of the Financial Markets (pp. 209–211). New York Institute of Finance, 1999. ISBN 0-7352-0066-1