

Biplot
Encyclopedia
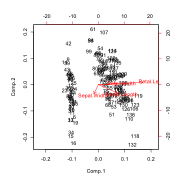
Biplots are a type of exploratory graph used in statistics
Statistics
Statistics is the study of the collection, organization, analysis, and interpretation of data. It deals with all aspects of this, including the planning of data collection in terms of the design of surveys and experiments....
, a generalization of the simple two-variable scatterplot. A biplot allows information on both samples
Sampling (statistics)
In statistics and survey methodology, sampling is concerned with the selection of a subset of individuals from within a population to estimate characteristics of the whole population....
and variables of a data matrix to be displayed graphically. Samples are displayed as points while variables are displayed either as vectors, linear axes or nonlinear trajectories. In the case of categorical variables, category level points may be used to represent the levels of a categorical variable. A generalised biplot displays information on both continuous and categorical variables.
Introduction and history
The biplot was introduced by Gabriel (1971). Gower and Hand (1996) wrote a monograph on biplots. Yan and Kang (2003) described various methods which can be used in order to visualize and interpret a biplot. The book by Greenacre (2010) is a practical user-oriented guide to biplots, along with scripts in the open-source R programming language, to generate biplots associated with principal component analysis (PCA), multidimensional scalingMultidimensional scaling
Multidimensional scaling is a set of related statistical techniques often used in information visualization for exploring similarities or dissimilarities in data. MDS is a special case of ordination. An MDS algorithm starts with a matrix of item–item similarities, then assigns a location to each...
(MDS), log-ratio analysis (LRA) - also known as spectral mapping - discriminant analysis (DA) and various forms of correspondence analysis
Correspondence analysis
Correspondence analysis is a multivariate statistical technique proposed by Hirschfeld and later developed by Jean-Paul Benzécri. It is conceptually similar to principal component analysis, but applies to categorical rather than continuous data...
: simple correspondence analysis (CA), multiple correspondence analysis (MCA) and canonical correspondence analysis (CCA). The book by Gower, Lubbe and le Roux (2011) aims to popularize biplots as a useful and reliable method for the visualization of multivariate data when researchers want to consider, for example, principal component analysis (PCA), canonical variates analysis (CVA) or various types of correspondence analysis.
Construction
A biplot is constructed by using the singular value decompositionSingular value decomposition
In linear algebra, the singular value decomposition is a factorization of a real or complex matrix, with many useful applications in signal processing and statistics....
(SVD) to obtain a low-rank approximation to a transformed version of the data matrix X, whose n rows are the samples (also called the cases, or objects), and whose p columns are the variables. The transformed data matrix Y is obtained from the original matrix X by centering and optionally standardizing the columns (the variables). Using the SVD, we can write Y = ∑k=1,...pdkukvkT;, where the uk are n-dimensional column vectors, the vk are p-dimensional column vectors, and the dk are a non-increasing sequence of non-negative scalars
Scalar (mathematics)
In linear algebra, real numbers are called scalars and relate to vectors in a vector space through the operation of scalar multiplication, in which a vector can be multiplied by a number to produce another vector....
. The biplot is formed from two scatterplots that share a common set of axes and have a between-set scalar product interpretation. The first scatterplot is formed from the points (d1αu1i, d2αu2i), for i = 1,...,n. The second plot is formed from the points (d11-αv1j, d21-αv2j), for j = 1,...,p. This is the biplot formed by the dominant two terms of the SVD, which can then be represented in a two-dimensional display. Typical choices of α are 1 (to give a distance interpretation to the row display) and 0 (to give a distance interpretation to the column display), and in some rare cases α=1/2 to obtain a symmetrically scaled biplot (which gives no distance interpretation to the rows or the columns, but only the scalar product interpretation). The set of points depicting the variables can be drawn as arrows from the origin to reinforce the idea that they represent biplot axes onto which the samples can be projected to approximate the original data.
Sources
- Gower, J.C., Lubbe, S. and le Roux, N. (due January 2011). Understanding Biplots. Wiley. ISBN 978-0-470-01255-0
- Gower, J.C. and Hand, D.J (1996). Biplots. Chapman & Hall, London, UK. ISBN 0412716305
- Greenacre, M. (2010). Biplots in Practice. BBVA Foundation, Madrid, Spain. Available for free download ISBN 978-84-923846-8-6, with materials.
- Yan, W. and Kang, M.S. (2003). GGE Biplot Analysis. CRC PressCRC PressThe CRC Press, LLC is a publishing group which specializes in producing technical books. While many of their books relate to engineering, science and mathematics, their scope also includes books on business, forensics and information technology...
, Boca Raton, FL. ISBN 0849313384 - Vicente-Villardón, J.L., Galindo-Villardón, M.P. and Blázquez-Zaballos, A. (2006). Logistic Biplots. In: Multiple Correspondence Analysis and Related Methods. Greenacre, M. and Blasius, J. (Eds) Chapman & Hall/CRC PressCRC PressThe CRC Press, LLC is a publishing group which specializes in producing technical books. While many of their books relate to engineering, science and mathematics, their scope also includes books on business, forensics and information technology...
. Boca Raton. USA. ISBN 1584886285 - Demey, J.R., Vicente-Villardón, J.L., Galindo-Villardón, M.P. and Zambrano, A.Y. (2008). Identifying molecular markers associated with classification of genotypes by External Logistic Biplots. BioinformaticsBioinformaticsBioinformatics is the application of computer science and information technology to the field of biology and medicine. Bioinformatics deals with algorithms, databases and information systems, web technologies, artificial intelligence and soft computing, information and computation theory, software...
. 24(24):2832-2838