

Activity diagram
Encyclopedia
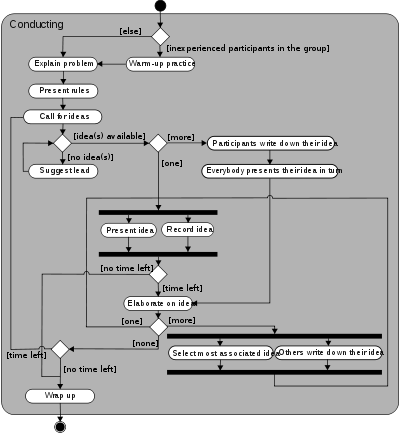
Activity diagrams are graphical representations of workflow
Workflow
A workflow consists of a sequence of connected steps. It is a depiction of a sequence of operations, declared as work of a person, a group of persons, an organization of staff, or one or more simple or complex mechanisms. Workflow may be seen as any abstraction of real work...
s of stepwise activities and actions with support for choice, iteration and concurrency. In the Unified Modeling Language
Unified Modeling Language
Unified Modeling Language is a standardized general-purpose modeling language in the field of object-oriented software engineering. The standard is managed, and was created, by the Object Management Group...
, activity diagrams can be used to describe the business and operational step-by-step workflows of components in a system. An activity diagram shows the overall flow of control.
Construction
Activity diagrams are constructed from a limited number of shapes, connected with arrows. The most important shape types:- rounded rectangles represent activities;
- diamonds represent decisions;
- bars represent the start (split) or end (join) of concurrent activities;
- a black circle represents the start (initial state) of the workflow;
- an encircled black circle represents the end (final state).
Arrows run from the start towards the end and represent the order in which activities happen.
Hence they can be regarded as a form of flowchart
Flowchart
A flowchart is a type of diagram that represents an algorithm or process, showing the steps as boxes of various kinds, and their order by connecting these with arrows. This diagrammatic representation can give a step-by-step solution to a given problem. Process operations are represented in these...
. Typical flowchart techniques lack constructs for expressing concurrency. However, the join and split symbols in activity diagrams only resolve this for simple cases; the meaning of the model is not clear when they are arbitrarily combined with decisions or loops.
While in UML 1.x, activity diagrams were a specialized form of state diagrams, in UML 2.x, the activity diagrams were reformalized to be based on Petri net
Petri net
A Petri net is one of several mathematical modeling languages for the description of distributed systems. A Petri net is a directed bipartite graph, in which the nodes represent transitions and places...
-like semantics, increasing the scope of situations that can be modeled using activity diagrams. These changes cause many UML 1.x activity diagrams to be interpreted differently in UML 2.x
Applications
In SysMLSystems Modeling Language
The Systems Modeling Language is a general-purpose modeling language for systems engineering applications. It supports the specification, analysis, design, verification and validation of a broad range of systems and systems-of-systems. SysML was originally developed by an open source specification...
the activity diagram has been extended to indicate flows among steps that convey physical matter (e.g., gasoline) or energy (e.g., torque, pressure). Additional changes allow the diagram to better support continuous behaviors and continuous data flows.
Alternatives
In UML 1.x, an alternative to activity diagrams is the UML State diagram, in which states can be used to represent activities (namely the state of that activity being performed), and transitions represent the start or completion of activities.This mapping of activity diagram features to state diagram were formalized in UML 1.x, leaving activity diagrams little more than the use of state machines to capture behavior and partially concurrent behavior within a work flow.
Despite the (small) advantages of using UML 1.x activity diagram over state machines, such as the ability to cover the behaviors of collaborating elements, while state machines are limited to a single element, many modelers continued using state diagrams. State machines were attractive to use as the states may also represent conditions that hold before or after the activities. Activity diagrams and state diagram had similar abilities to express concurrency, though the run-to-completion (RTC) semantics of State machines limited the expressiveness of the concurrency.
Perhaps the most important reason why state machines were more popular in UML 1.x over activity diagrams was that the tool vendors were slow to implement robust activity diagram capabilities.
With UML 2.x, the foundation of activity diagram changed from being based on state-machine semantics to now being based on Petri net
Petri net
A Petri net is one of several mathematical modeling languages for the description of distributed systems. A Petri net is a directed bipartite graph, in which the nodes represent transitions and places...
semantics. This vastly expanded the number of circumstances where activity diagrams are more appropriate to capture the paths of work flow in a system. Now with the advent of robust activity diagram implementations, activity diagrams are now generally used more than state machine diagrams.
See also
- Control flow graphControl flow graphA control flow graph in computer science is a representation, using graph notation, of all paths that might be traversed through a program during its execution.- Overview :...
- FlowchartFlowchartA flowchart is a type of diagram that represents an algorithm or process, showing the steps as boxes of various kinds, and their order by connecting these with arrows. This diagrammatic representation can give a step-by-step solution to a given problem. Process operations are represented in these...
- Data flow diagramData flow diagramA data flow diagram is a graphical representation of the "flow" of data through an information system, modelling its process aspects. Often they are a preliminary step used to create an overview of the system which can later be elaborated...
- Event-driven process chainEvent-driven process chainAn Event-driven Process Chain is a type of flowchart used for business process modelling. EPC's can be used for configuring an enterprise resource planning implementation, and for business process improvement.- Overview :...
- Petri netPetri netA Petri net is one of several mathematical modeling languages for the description of distributed systems. A Petri net is a directed bipartite graph, in which the nodes represent transitions and places...
- List of UML tools
- State diagramState diagramA state diagram is a type of diagram used in computer science and related fields to describe the behavior of systems. State diagrams require that the system described is composed of a finite number of states; sometimes, this is indeed the case, while at other times this is a reasonable abstraction...
- PseudocodePseudocodeIn computer science and numerical computation, pseudocode is a compact and informal high-level description of the operating principle of a computer program or other algorithm. It uses the structural conventions of a programming language, but is intended for human reading rather than machine reading...
- Business Process Modeling NotationBusiness Process Modeling NotationBusiness Process Model and Notation is a graphical representation for specifying business processes in a business process model. It was previously known as Business Process Modeling Notation....