Wallenius' noncentral hypergeometric distribution
Encyclopedia

Probability theory
Probability theory is the branch of mathematics concerned with analysis of random phenomena. The central objects of probability theory are random variables, stochastic processes, and events: mathematical abstractions of non-deterministic events or measured quantities that may either be single...
and statistics
Statistics
Statistics is the study of the collection, organization, analysis, and interpretation of data. It deals with all aspects of this, including the planning of data collection in terms of the design of surveys and experiments....
, Wallenius' noncentral hypergeometric distribution (named after Kenneth Ted Wallenius) is a generalization of the hypergeometric distribution where items are sampled with bias
Biased sample
In statistics, sampling bias is when a sample is collected in such a way that some members of the intended population are less likely to be included than others. It results in a biased sample, a non-random sample of a population in which all individuals, or instances, were not equally likely to...
.
This distribution can be illustrated as an urn model
Urn problem
In probability and statistics, an urn problem is an idealized mental exercise in which some objects of real interest are represented as colored balls in an urn or other container....
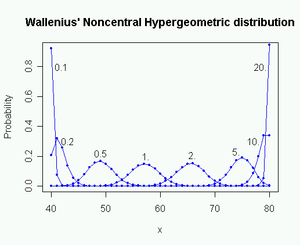
with bias. Assume, for example, that an urn contains m1 red balls and m2 white balls, totalling N = m1 + m2 balls. Each red ball has the weight ω1 and each white ball has the weight ω2. We will say that the odds ratio is ω = ω1 / ω2. Now we are taking n balls, one by one, in such a way that the probability of taking a particular ball at a particular draw is equal to its proportion of the total weight of all balls that lie in the urn at that moment. The number of red balls x1 that we get in this experiment is a random variable with Wallenius' noncentral hypergeometric distribution.
The matter is complicated by the fact that there is more than one noncentral hypergeometric distribution. Wallenius' noncentral hypergeometric distribution is obtained if balls are sampled one by one in such a way that there is competition
Competition
Competition is a contest between individuals, groups, animals, etc. for territory, a niche, or a location of resources. It arises whenever two and only two strive for a goal which cannot be shared. Competition occurs naturally between living organisms which co-exist in the same environment. For...
between the balls. Fisher's noncentral hypergeometric distribution
Fisher's noncentral hypergeometric distribution
In probability theory and statistics, Fisher's noncentral hypergeometric distribution is a generalization of the hypergeometric distribution where sampling probabilities are modified by weight factors...
is obtained if the balls are sampled simultaneously or independently of each other. Unfortunately, both distributions are known in the literature as "the" noncentral hypergeometric distribution. It is important to be specific about which distribution is meant when using this name.
The two distributions are both equal to the (central) hypergeometric distribution when the odds ratio is 1.
It is far from obvious why these two distributions are different. See the Wikipedia entry on noncentral hypergeometric distributions
Noncentral hypergeometric distributions
In statistics, the hypergeometric distribution is the discrete probability distribution generated by picking colored balls at random from an urn without replacement....
for a more detailed explanation of the difference between these two probability distributions.
Univariate distribution

This recursive dependency gives rise to a difference equation with a solution that is given in open form
Closed-form expression
In mathematics, an expression is said to be a closed-form expression if it can be expressed analytically in terms of a bounded number of certain "well-known" functions...
by the integral in the expression of the probability mass function in the table above.
Closed form expressions
Closed-form expression
In mathematics, an expression is said to be a closed-form expression if it can be expressed analytically in terms of a bounded number of certain "well-known" functions...
for the probability mass function exist (Lyons, 1980), but they are not very useful for practical calculations because of extreme numerical instability
Numerical stability
In the mathematical subfield of numerical analysis, numerical stability is a desirable property of numerical algorithms. The precise definition of stability depends on the context, but it is related to the accuracy of the algorithm....
, except in degenerate cases.
Several other calculation methods are used, including recursion
Recursion
Recursion is the process of repeating items in a self-similar way. For instance, when the surfaces of two mirrors are exactly parallel with each other the nested images that occur are a form of infinite recursion. The term has a variety of meanings specific to a variety of disciplines ranging from...
, Taylor expansion
Taylor series
In mathematics, a Taylor series is a representation of a function as an infinite sum of terms that are calculated from the values of the function's derivatives at a single point....
and numerical integration
Numerical integration
In numerical analysis, numerical integration constitutes a broad family of algorithms for calculating the numerical value of a definite integral, and by extension, the term is also sometimes used to describe the numerical solution of differential equations. This article focuses on calculation of...
(Fog, 2007, 2008).
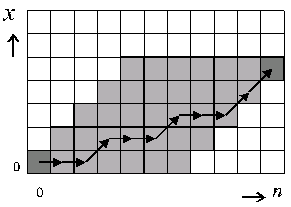
The most reliable calculation method is recursive calculation of f(x,n) from f(x,n-1) and f(x-1,n-1) using the recursion formula given below under properties. The probabilities of all (x,n) combinations on all possible trajectories
Trajectory
A trajectory is the path that a moving object follows through space as a function of time. The object might be a projectile or a satellite, for example. It thus includes the meaning of orbit—the path of a planet, an asteroid or a comet as it travels around a central mass...
leading to the desired point are calculated, starting with f(0,0) = 1 as shown on the figure to the right. The total number of probabilities to calculate is n(x+1)-x2. Other calculation methods must be used when n and x are so big that this method is too inefficient.
The probability that all balls have the same color is easier to calculate. See the formula below under multivariate distribution.
No exact formula for the mean is known (short of complete enumeration of all probabilities). The equation given above is reasonably accurate. This equation can be solved for μ by Newton-Raphson iteration
Newton's method
In numerical analysis, Newton's method , named after Isaac Newton and Joseph Raphson, is a method for finding successively better approximations to the roots of a real-valued function. The algorithm is first in the class of Householder's methods, succeeded by Halley's method...
. The same equation can be used for estimating the odds from an experimentally obtained value of the mean.
Properties of the univariate distribution
Wallenius' distribution has fewer symmetry relations than Fisher's noncentral hypergeometric distributionFisher's noncentral hypergeometric distribution
In probability theory and statistics, Fisher's noncentral hypergeometric distribution is a generalization of the hypergeometric distribution where sampling probabilities are modified by weight factors...
has. The only symmetry relates to the swapping of colors:

Unlike Fisher's distribution, Wallenius' distribution has no symmetry relating to the number of balls not taken.
The following recursion formula is useful for calculating probabilities:

Another recursion formula is also known:

The probability is limited by


where the underlined superscript indicates the falling factorial
Pochhammer symbol
In mathematics, the Pochhammer symbol introduced by Leo August Pochhammer is the notation ', where is a non-negative integer. Depending on the context the Pochhammer symbol may represent either the rising factorial or the falling factorial as defined below. Care needs to be taken to check which...
 .
.Multivariate distribution
The distribution can be expanded to any number of colors c of balls in the urn. The multivariate distribution is used when there are more than two colors.The probability mass function can be calculated by various Taylor expansion
Taylor series
In mathematics, a Taylor series is a representation of a function as an infinite sum of terms that are calculated from the values of the function's derivatives at a single point....
methods or by numerical integration
Numerical integration
In numerical analysis, numerical integration constitutes a broad family of algorithms for calculating the numerical value of a definite integral, and by extension, the term is also sometimes used to describe the numerical solution of differential equations. This article focuses on calculation of...
(Fog, 2008).
The probability that all balls have the same color, j, can be calculated as:

for xj = n ≤ mj, where the underlined superscript denotes the falling factorial
Pochhammer symbol
In mathematics, the Pochhammer symbol introduced by Leo August Pochhammer is the notation ', where is a non-negative integer. Depending on the context the Pochhammer symbol may represent either the rising factorial or the falling factorial as defined below. Care needs to be taken to check which...
.
A reasonably good approximation to the mean can be calculated using the equation given above. The equation can be solved by defining θ so that

and solving

for θ by Newton-Raphson iteration
Newton's method
In numerical analysis, Newton's method , named after Isaac Newton and Joseph Raphson, is a method for finding successively better approximations to the roots of a real-valued function. The algorithm is first in the class of Householder's methods, succeeded by Halley's method...
.
The equation for the mean is also useful for estimating the odds from experimentally obtained values for the mean.
No good way of calculating the variance is known. The best known method is to approximate the multivariate Wallenius distribution by a multivariate Fisher's noncentral hypergeometric distribution
Fisher's noncentral hypergeometric distribution
In probability theory and statistics, Fisher's noncentral hypergeometric distribution is a generalization of the hypergeometric distribution where sampling probabilities are modified by weight factors...
with the same mean, and insert the mean as calculated above in the approximate formula for the variance of the latter distribution.
Properties of the multivariate distribution
The order of the colors is arbitrary so that any colors can be swapped.The weights can be arbitrarily scaled:
 for all
  .
.Colors with zero number (mi = 0) or zero weight (ωi = 0) can be omitted from the equations.
Colors with the same weight can be joined:

where
 is the (univariate, central) hypergeometric distribution probability.
Complementary Wallenius' noncentral hypergeometric distribution

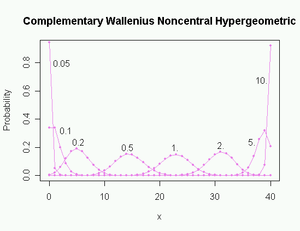
Probabilities in the complementary distribution are calculated from Wallenius' distribution by replacing n with N-n, xi with mi - xi, and ωi with 1/ωi.
Software available
- WalleniusHypergeometricDistribution in MathematicaMathematicaMathematica is a computational software program used in scientific, engineering, and mathematical fields and other areas of technical computing...
. - An implementation for the R programming languageR (programming language)R is a programming language and software environment for statistical computing and graphics. The R language is widely used among statisticians for developing statistical software, and R is widely used for statistical software development and data analysis....
is available as the package named BiasedUrn. Includes univariate and multivariate probability mass functions, distribution functions, quantileQuantileQuantiles are points taken at regular intervals from the cumulative distribution function of a random variable. Dividing ordered data into q essentially equal-sized data subsets is the motivation for q-quantiles; the quantiles are the data values marking the boundaries between consecutive subsets...
s, random variableRandom variableIn probability and statistics, a random variable or stochastic variable is, roughly speaking, a variable whose value results from a measurement on some type of random process. Formally, it is a function from a probability space, typically to the real numbers, which is measurable functionmeasurable...
generating functions, mean and variance. - Implementation in C++C++C++ is a statically typed, free-form, multi-paradigm, compiled, general-purpose programming language. It is regarded as an intermediate-level language, as it comprises a combination of both high-level and low-level language features. It was developed by Bjarne Stroustrup starting in 1979 at Bell...
is available from www.agner.org.
See also
- Noncentral hypergeometric distributionsNoncentral hypergeometric distributionsIn statistics, the hypergeometric distribution is the discrete probability distribution generated by picking colored balls at random from an urn without replacement....
- Fisher's noncentral hypergeometric distributionFisher's noncentral hypergeometric distributionIn probability theory and statistics, Fisher's noncentral hypergeometric distribution is a generalization of the hypergeometric distribution where sampling probabilities are modified by weight factors...
- Hypergeometric distribution
- Urn modelsUrn problemIn probability and statistics, an urn problem is an idealized mental exercise in which some objects of real interest are represented as colored balls in an urn or other container....
- Biased sampleBiased sampleIn statistics, sampling bias is when a sample is collected in such a way that some members of the intended population are less likely to be included than others. It results in a biased sample, a non-random sample of a population in which all individuals, or instances, were not equally likely to...
- BiasBias (statistics)A statistic is biased if it is calculated in such a way that it is systematically different from the population parameter of interest. The following lists some types of, or aspects of, bias which should not be considered mutually exclusive:...
- Population geneticsPopulation geneticsPopulation genetics is the study of allele frequency distribution and change under the influence of the four main evolutionary processes: natural selection, genetic drift, mutation and gene flow. It also takes into account the factors of recombination, population subdivision and population...
- Fisher's exact testFisher's exact testFisher's exact test is a statistical significance test used in the analysis of contingency tables where sample sizes are small. It is named after its inventor, R. A...


