

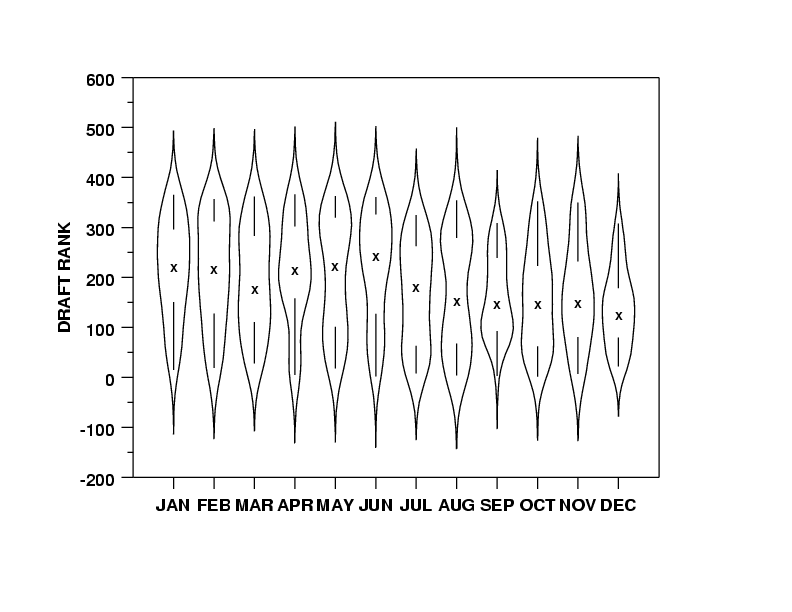
Violin plot
Encyclopedia
Box plot
In descriptive statistics, a box plot or boxplot is a convenient way of graphically depicting groups of numerical data through their five-number summaries: the smallest observation , lower quartile , median , upper quartile , and largest observation...
and a kernel density plot
Kernel density estimation
In statistics, kernel density estimation is a non-parametric way of estimating the probability density function of a random variable. Kernel density estimation is a fundamental data smoothing problem where inferences about the population are made, based on a finite data sample...
. Specifically, it starts with a box plot. It then adds a rotated kernel density plot to each side of the box plot..
The violin plot is similar to box plot
Box plot
In descriptive statistics, a box plot or boxplot is a convenient way of graphically depicting groups of numerical data through their five-number summaries: the smallest observation , lower quartile , median , upper quartile , and largest observation...
s, except that they also show the probability density
Probability density function
In probability theory, a probability density function , or density of a continuous random variable is a function that describes the relative likelihood for this random variable to occur at a given point. The probability for the random variable to fall within a particular region is given by the...
of the data at different values (in the simplest case this could be a histogram
Histogram
In statistics, a histogram is a graphical representation showing a visual impression of the distribution of data. It is an estimate of the probability distribution of a continuous variable and was first introduced by Karl Pearson...
). Typically violin plots will include a marker for the median of the data and a box indicating the interquartile range, as in standard box plots. Overlaid on this box plot is a kernel density estimation
Kernel density estimation
In statistics, kernel density estimation is a non-parametric way of estimating the probability density function of a random variable. Kernel density estimation is a fundamental data smoothing problem where inferences about the population are made, based on a finite data sample...
.
Violin plots are available as extensions to a number of software packages, including R through the vioplot and lattice libraries, and Stata through the vioplot add-in.
External links
- Vioplot add-in for Stata
- Example of violin plots in R
- Violin plots in Python with MatplotlibMatplotlibmatplotlib is a plotting library for the Python programming language and its NumPy numerical mathematics extension. It provides an object-oriented API which allows plots to be embedded into applications using generic GUI toolkits, like wxPython, Qt, or GTK...