
.gif)
Triangle (technical analysis)
Encyclopedia
Triangles are a commonly found in the price charts of financially traded assets (stocks, bonds, futures, etc). The pattern derives its name from the fact that it is characterized by a contraction in price range and converging trendlines, thus giving it a triangular shape.
Triangle Patterns can be broken down into three categories: the ascending triangle, the descending triangle, and the symmetrical triangle. While the shape of the triangle is significant, of more importance is the direction that the market moves when it breaks out of the triangle. Lastly, while triangles can sometimes be reversal patterns—meaning a reversal of the prior trend—they are normally seen as continuation patterns (meaning a continuation of the prior trend).
The chart below offers an example of an ascending triangle.

The image below illustrates.

The image below illustrates.
Triangle Patterns can be broken down into three categories: the ascending triangle, the descending triangle, and the symmetrical triangle. While the shape of the triangle is significant, of more importance is the direction that the market moves when it breaks out of the triangle. Lastly, while triangles can sometimes be reversal patterns—meaning a reversal of the prior trend—they are normally seen as continuation patterns (meaning a continuation of the prior trend).
The Ascending Triangle
The ascending triangle is formed when the market makes higher lows and the same level highs. These patterns are normally seen in an uptrend and viewed as a continuation pattern as buying demand gain more and more control, running up to the top resistance line of the pattern. While you normally will see this pattern form in an uptrend, if you do see it in a downtrend it should be paid attention to as it can act as a powerful reversal signal.The chart below offers an example of an ascending triangle.
The Descending Triangle
The descending triangle is formed when the market makes lower highs and the same level lows. These patterns are normally seen in a downtrend and viewed as a continuation pattern as the bears gain more and more control running down to the bottom support line of the pattern. While you normally will see this pattern form in a downtrend, if you do see it in an uptrend it should be paid attention to as it can act as a powerful reversal signal.The image below illustrates.
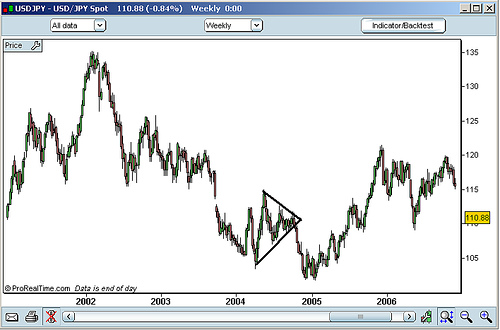
The Symmetrical Triangle
The symmetrical triangle is formed when the market makes lower highs and higher lows and is commonly associated with directionless markets as the contraction of the market range indicates that neither the bulls nor the bears are in control. If this pattern forms in an uptrend then it is considered a continuation pattern if the market breaks out to the upside and a reversal pattern if the market breaks to the downside. Similarly if the pattern forms in a downtrend it is considered a continuation pattern if the market breaks out to the downside and a reversal pattern if the market breaks to the upside.The image below illustrates.
External links
- How To Trade the Triangle Chart Pattern at StockChartPatterns.org
See also
- Technical AnalysisTechnical analysisIn finance, technical analysis is security analysis discipline for forecasting the direction of prices through the study of past market data, primarily price and volume. Behavioral economics and quantitative analysis incorporate technical analysis, which being an aspect of active management stands...
- Chart pattern
- Support (technical analysis)Support (technical analysis)Support and resistance is a concept in technical analysis that the movement of the price of a security will tend to stop and reverse at certain predetermined price levels.- Support :...