

Solar Saros 136
Encyclopedia
Solar Saros 139
Solar Saros 139 repeats every 18 years, 11 days. Saros 139 contains 71 events of which 16 will be partial eclipses, 12 will be hybrid and 43 will be total. The first total eclipse occurred on December 21, 1843 over southern Asia and lasted 1 minutes and 43 seconds...
(whose eclipses are getting slightly longer) on May 22, 2096
Solar eclipse of May 22, 2096
A total solar eclipse will occur on May 22, 2096. This will be the first eclipse of saros series 139 to exceed series 136 in length of totality. The length of totality for saros 139 is increasing, while that of Saros 136 is decreasing....
. Saros 136 will ultimately produce a total of 44 total eclipses. It produced the most central
Gamma (solar eclipse)
Gamma of an eclipse describes how centrally the shadow of the moon or earth strikes the other. The distance, when the axis of the shadow cone passes closest to earth or moon's center, is stated as fraction of the equatorial radius of the earth...
total eclipse between the years 1209 and 2718 and the greatest magnitude
Magnitude of eclipse
The magnitude of eclipse or geometric magnitude is the fraction of the diameter of the eclipsed body which is in eclipse. This applies to both solar eclipses and lunar eclipses. During a partial or annular eclipse the magnitude of the eclipse is always between 0.0 and 1.0, while during a total...
of any eclipse since the year 540 on July 11, 1991
Solar eclipse of July 11, 1991
A total solar eclipse occurred on July 11, 1991. Totality beginning over the Pacific Ocean and Hawaii moving across Mexico, down through Central America and across South America ending over Brazil. It lasted for 6 minutes and 53 seconds at the point of maximum eclipse...
.
Events
| Saros | Member | Date | Time (Greatest) UTC |
Type | Location Lat,Long |
Gamma Gamma (solar eclipse) Gamma of an eclipse describes how centrally the shadow of the moon or earth strikes the other. The distance, when the axis of the shadow cone passes closest to earth or moon's center, is stated as fraction of the equatorial radius of the earth... |
Mag. Magnitude of eclipse The magnitude of eclipse or geometric magnitude is the fraction of the diameter of the eclipsed body which is in eclipse. This applies to both solar eclipses and lunar eclipses. During a partial or annular eclipse the magnitude of the eclipse is always between 0.0 and 1.0, while during a total... |
Width (km) |
Duration (min:sec) |
Ref |
|---|---|---|---|---|---|---|---|---|---|---|
| 136 | 1 | June 14, 1360 | 5:56:04 | Partial | 65.8S 78.2E | |||||
| 0.0495 | http://eclipse.gsfc.nasa.gov/5MCSEmap/1301-1400/1360-06-14.gif | |||||||||
| 136 | 2 | June 25, 1378 | 12:45:16 | Partial | 64.8S 34.2W | |||||
| 0.1976 | http://eclipse.gsfc.nasa.gov/5MCSEmap/1301-1400/1378-06-25.gif | |||||||||
| 136 | 3 | July 5, 1396 | 19:37:40 | Partial | 63.9S 147.2W | |||||
| 0.3449 | http://eclipse.gsfc.nasa.gov/5MCSEmap/1301-1400/1396-07-05.gif | |||||||||
| 136 | 4 | July 17, 1414 | 2:35:03 | Partial | 63.1S 99E | |||||
| 0.4881 | http://eclipse.gsfc.nasa.gov/5MCSEmap/1401-1500/1414-07-17.gif | |||||||||
| 136 | 5 | July 27, 1432 | 9:39:02 | Partial | 62.4S 16.3W | |||||
| 0.625 | http://eclipse.gsfc.nasa.gov/5MCSEmap/1401-1500/1432-07-27.gif | |||||||||
| 136 | 6 | August 7, 1450 | 16:48:49 | Partial | 61.8S 132.8W | |||||
| 0.756 | http://eclipse.gsfc.nasa.gov/5MCSEmap/1401-1500/1450-08-07.gif | |||||||||
| 136 | 7 | August 18, 1468 | 0:08:08 | Partial | 61.3S 108.4E | |||||
| 0.8753 | http://eclipse.gsfc.nasa.gov/5MCSEmap/1401-1500/1468-08-18.gif | |||||||||
| 136 | 8 | August 29, 1486 | 7:34:56 | Partial | 61S 12.1W | |||||
| 0.9856 | http://eclipse.gsfc.nasa.gov/5MCSEmap/1401-1500/1486-08-29.gif | |||||||||
| 136 | 9 | September 8, 1504 | 15:12:15 | Annular | 55.3S 102.6W | |||||
| 0.9924 | 83 | 0m 32s | http://eclipse.gsfc.nasa.gov/5MCSEmap/1501-1600/1504-09-08.gif | |||||||
| 136 | 10 | September 19, 1522 | 22:57:33 | Annular | 53.9S 146.1E | |||||
| 0.9946 | 42 | 0m 23s | http://eclipse.gsfc.nasa.gov/5MCSEmap/1501-1600/1522-09-19.gif | |||||||
| 136 | 11 | September 30, 1540 | 6:54:11 | Annular | 54.6S 29.2E | |||||
| 0.996 | 27 | 0m 17s | http://eclipse.gsfc.nasa.gov/5MCSEmap/1501-1600/1540-09-30.gif | |||||||
| 136 | 12 | October 11, 1558 | 14:58:55 | Annular | 56.5S 90.3W | |||||
| 0.9971 | 18 | 0m 12s | http://eclipse.gsfc.nasa.gov/5MCSEmap/1501-1600/1558-10-11.gif | |||||||
| 136 | 13 | October 21, 1576 | 23:13:06 | Annular | 59.2S 147.9E | |||||
| 0.9981 | 11 | 0m 8s | http://eclipse.gsfc.nasa.gov/5MCSEmap/1501-1600/1576-10-21.gif | |||||||
| 136 | 14 | November 12, 1594 | 7:34:49 | Annular | 62.4S 25.1E | |||||
| 0.9991 | 5 | 0m 4s | http://eclipse.gsfc.nasa.gov/5MCSEmap/1501-1600/1594-11-12.gif | |||||||
| 136 | 15 | November 22, 1612 | 16:04:35 | Hybrid | 65.7S 98.4W | |||||
| 1.0002 | 1 | 0m 1s | http://eclipse.gsfc.nasa.gov/5MCSEmap/1601-1700/1612-11-22.gif | |||||||
| 136 | 16 | December 4, 1630 | 0:38:59 | Hybrid | 68.7S 139.6E | |||||
| 1.0017 | 9 | 0m 7s | http://eclipse.gsfc.nasa.gov/5MCSEmap/1601-1700/1630-12-04.gif | |||||||
| 136 | 17 | December 14, 1648 | 9:17:55 | Hybrid | 70.9S 19.6E | |||||
| 1.0035 | 18 | 0m 14s | http://eclipse.gsfc.nasa.gov/5MCSEmap/1601-1700/1648-12-14.gif | |||||||
| 136 | 18 | December 25, 1666 | 17:59:16 | Hybrid | 71.6S 98.3W | |||||
| 1.0058 | 30 | 0m 24s | http://eclipse.gsfc.nasa.gov/5MCSEmap/1601-1700/1666-12-25.gif | |||||||
| 136 | 19 | January 5, 1685 | 2:42:50 | Hybrid | 70.7S 143.1E | |||||
| 1.0086 | 44 | 0m 35s | http://eclipse.gsfc.nasa.gov/5MCSEmap/1601-1700/1685-01-05.gif | |||||||
| 136 | 20 | January 17, 1703 | 11:24:25 | Hybrid | 67.9S 22.2E | |||||
| 1.012 | 61 | 0m 50s | http://eclipse.gsfc.nasa.gov/5MCSEmap/1701-1800/1703-01-17.gif | |||||||
| 136 | 21 | January 27, 1721 | 20:05:11 | Total | 64S 102.4W | |||||
| 1.0158 | 79 | 1m 7s | http://eclipse.gsfc.nasa.gov/5MCSEmap/1701-1800/1721-01-27.gif | |||||||
| 136 | 22 | February 8, 1739 | 4:41:13 | Total | 59.2S 131E | |||||
| 1.0203 | 99 | 1m 27s | http://eclipse.gsfc.nasa.gov/5MCSEmap/1701-1800/1739-02-08.gif | |||||||
| 136 | 23 | February 18, 1757 | 13:14:12 | Total | 53.8S 2.9E | |||||
| 1.0251 | 119 | 1m 51s | http://eclipse.gsfc.nasa.gov/5MCSEmap/1701-1800/1757-02-18.gif | |||||||
| 136 | 24 | March 1, 1775 | 21:39:20 | Total | 47.9S 124.8W | |||||
| 1.0304 | 139 | 2m 20s | http://eclipse.gsfc.nasa.gov/5MCSEmap/1701-1800/1775-03-01.gif | |||||||
| 136 | 25 | March 12, 1793 | 6:00:07 | Total | 41.7S 107.8E | |||||
| 1.0359 | 158 | 2m 51s | http://eclipse.gsfc.nasa.gov/5MCSEmap/1701-1800/1793-03-12.gif | |||||||
| 136 | 26 | March 24, 1811 | 14:12:13 | Total | 35.2S 18W | |||||
| 1.0416 | 176 | 3m 27s | http://eclipse.gsfc.nasa.gov/5MCSEmap/1801-1900/1811-03-24.gif | |||||||
| 136 | 27 | April 3, 1829 | 22:18:36 | Total | 28.5S 142.6W | |||||
| 1.0474 | 192 | 4m 5s | http://eclipse.gsfc.nasa.gov/5MCSEmap/1801-1900/1829-04-03.gif | |||||||
| 136 | 28 | April 15, 1847 | 6:16:13 | Total | 21.6S 95E | |||||
| 1.053 | 206 | 4m 44s | http://eclipse.gsfc.nasa.gov/5MCSEmap/1801-1900/1847-04-15.gif | |||||||
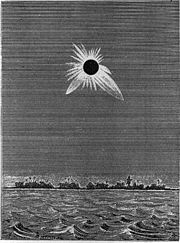
| 136 | 29 | April 25, 1865 Solar eclipse of April 25, 1865 A total solar eclipse occurred on April 25, 1865. -References:* * * * by Mabel Loomis Todd, 1900... |
14:08:34 | Total | 14.8S 25.8W | |||||
| 1.0584 | 219 | 5m 23s | http://eclipse.gsfc.nasa.gov/5MCSEmap/1801-1900/1865-04-25.gif | |||||||
| 136 | 30 | May 6, 1883 Solar eclipse of May 6, 1883 A total solar eclipse occurred on May 6, 1883. The path of totality fell across the southern Pacific Ocean with no major landfall. Partiality was visible from far eastern Australia at sunrise, and New Zealand, as well as western South America and southern Mexico near sunset... |
21:53:49 | Total | 8.1S 144.6W | |||||
| 1.0634 | 229 | 5m 58s | http://eclipse.gsfc.nasa.gov/5MCSEmap/1801-1900/1883-05-06.gif | |||||||
| 136 | 31 | May 18, 1901 Solar eclipse of May 18, 1901 A total solar eclipse occurred on May 18, 1901. The path of totality crossed Madagascar, Mauritius, Réunion, Indonesia, Malaysia, Papua, New Guinea.-References:* * Lick Observatory Plate Archive, Mt. Hamilton.... |
5:33:48 | Total | 1.7S 98.4E | |||||
| 1.068 | 238 | 6m 29s | http://eclipse.gsfc.nasa.gov/5MCSEmap/1901-2000/1901-05-18.gif | |||||||
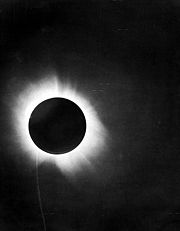
| 136 | 32 | May 29, 1919 Solar eclipse of May 29, 1919 A total solar eclipse occurred on May 29, 1919. With a maximum duration of totality of 6 minutes 51 seconds, it was one of the longest solar eclipses of the 20th century. It was visible throughout most of South America and Africa as a partial eclipse... |
13:08:55 | Total | 4.4N 16.7W | |||||
| 1.0719 | 244 | 6m 51s | http://eclipse.gsfc.nasa.gov/5MCSEmap/1901-2000/1919-05-29.gif | |||||||
| 136 | 33 | June 8, 1937 Solar eclipse of June 8, 1937 A total solar eclipse occurred on June 8, 1937. The path of totality crossed the pacific ocean starting in Micronesia, and ending at sunset in western South America.-References:*... |
20:41:02 | Total | 9.9N 130.5W | |||||
| 1.0751 | 250 | 7m 4s | http://eclipse.gsfc.nasa.gov/5MCSEmap/1901-2000/1937-06-08.gif | |||||||
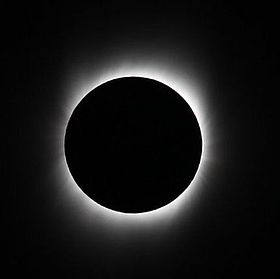
| 136 | 34 | June 20, 1955 Solar eclipse of June 20, 1955 A total solar eclipse occurred on June 20, 1955. With a maximum duration of 7 minutes 8 seconds, this is the longest solar eclipse of saros series 136, as well as the longest total solar eclipse since the 11th century... |
4:10:42 | Total | 14.8N 117E | |||||
| 1.0776 | 254 | 7m 8s | http://eclipse.gsfc.nasa.gov/5MCSEmap/1901-2000/1955-06-20.gif | |||||||
| 136 | 35 | June 30, 1973 Solar eclipse of June 30, 1973 A total solar eclipse occurred on June 30, 1973. - Observations :This eclipse was observed by a group of scientists from the Los Alamos National Laboratory using two airplanes to extend the apparent time of totality by flying along the eclipse path in the same direction as the Moon's shadow as it... |
11:38:41 | Total | 18.8N 5.6E | |||||
| 1.0792 | 256 | 7m 4s | http://eclipse.gsfc.nasa.gov/5MCSEmap/1901-2000/1973-06-30.gif | |||||||
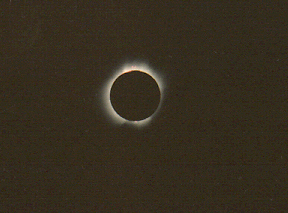
| 136 | 36 | July 11, 1991 Solar eclipse of July 11, 1991 A total solar eclipse occurred on July 11, 1991. Totality beginning over the Pacific Ocean and Hawaii moving across Mexico, down through Central America and across South America ending over Brazil. It lasted for 6 minutes and 53 seconds at the point of maximum eclipse... |
19:07:01 | Total | 22N 105.2W | |||||
| 1.08 | 258 | 6m 53s | http://eclipse.gsfc.nasa.gov/5MCSEmap/1901-2000/1991-07-11.gif | |||||||
| 136 | 37 | July 22, 2009 | 2:36:25 | Total | 24.2N 144.1E | 0.0698 | 1.0799 | 258 | 6m 39s | http://eclipse.gsfc.nasa.gov/5MCSEmap/2001-2100/2009-07-22.gif |
| 136 | 38 | August 2, 2027 Solar eclipse of August 2, 2027 A total solar eclipse will occur on August 2, 2027. The path of the eclipse will pass over all the countries of north African and middle eastern such Jedda, Mecca, Saudi Arabia, and Sana'a, Yemen... |
10:07:50 | Total | 25.5N 33.2E | 0.1421 | 1.079 | 258 | 6m 23s | http://eclipse.gsfc.nasa.gov/5MCSEmap/2001-2100/2027-08-02.gif |
| 136 | 39 | August 12, 2045 Solar eclipse of August 12, 2045 A total solar eclipse will occur on August 12, 2045. It will be the fourth longest eclipse of the 21st century. It will be visible throughout much of the continental United States, with a path of totality running through northern California, Nevada, Utah, Colorado, Kansas, Oklahoma, Arkansas,... |
17:42:39 | Total | 25.9N 78.5W | 0.2116 | 1.0774 | 256 | 6m 6s | http://eclipse.gsfc.nasa.gov/5MCSEmap/2001-2100/2045-08-12.gif |
| 136 | 40 | August 24, 2063 Solar eclipse of August 24, 2063 A total solar eclipse will occur on August 24, 2063. - External links :* http://eclipse.gsfc.nasa.gov/SEplot/SEplot2051/SE2063Aug24T.GIF... |
1:22:11 | Total | 25.6N 168.4E | 0.2771 | 1.075 | 252 | 5m 49s | http://eclipse.gsfc.nasa.gov/5MCSEmap/2001-2100/2063-08-24.gif |
| 136 | 41 | September 3, 2081 Solar eclipse of September 3, 2081 A total solar eclipse will occur on September 3, 2081. -References:... |
9:07:31 | Total | 24.6N 53.6E | 0.3378 | 1.072 | 247 | 5m 33s | http://eclipse.gsfc.nasa.gov/5MCSEmap/2001-2100/2081-09-03.gif |
| 136 | 42 | September 14, 2099 Solar eclipse of September 14, 2099 A total solar eclipse will occur on September 14, 2099. - Visibility :It will begin at sunrise off the western coast of Canada, and move eastern across Canada and the northern states of the United States and end in the Atlantic ocean... |
16:57:53 | Total | 23.4N 62.8W | 0.3942 | 1.0684 | 241 | 5m 18s | http://eclipse.gsfc.nasa.gov/5MCSEmap/2001-2100/2099-09-14.gif |
| 136 | 43 | September 26, 2117 Solar eclipse of September 26, 2117 A total solar eclipse will occur on September 26, 2117. - References:*... |
0:55:42 | Total | 21.9N 178.4E | 0.4442 | 1.0645 | 233 | 5m 3s | http://eclipse.gsfc.nasa.gov/5MCSEmap/2101-2200/2117-09-26.gif |
| 136 | 44 | October 7, 2135 | 9:00:03 | Total | 20.3N 57.6E | 0.4884 | 1.0603 | 224 | 4m 50s | http://eclipse.gsfc.nasa.gov/5MCSEmap/2101-2200/2135-10-07.gif |
| 136 | 45 | October 17, 2153 | 17:12:18 | Total | 18.8N 65.7W | 0.5259 | 1.056 | 214 | 4m 36s | http://eclipse.gsfc.nasa.gov/5MCSEmap/2101-2200/2153-10-17.gif |
| 136 | 46 | October 29, 2171 | 1:31:03 | Total | 17.6N 169.1E | 0.5577 | 1.0516 | 203 | 4m 23s | http://eclipse.gsfc.nasa.gov/5MCSEmap/2101-2200/2171-10-29.gif |
| 136 | 47 | November 8, 2189 | 9:57:28 | Total | 16.5N 41.6E | 0.583 | 1.0474 | 192 | 4m 10s | http://eclipse.gsfc.nasa.gov/5MCSEmap/2101-2200/2189-11-08.gif |
| 136 | 48 | November 20, 2207 | 18:30:26 | Total | 15.8N 87.8W | 0.6027 | 1.0434 | 180 | 3m 56s | http://eclipse.gsfc.nasa.gov/5MCSEmap/2201-2300/2207-11-20.gif |
| 136 | 49 | December 1, 2225 | 3:08:36 | Total | 15.4N 141.4E | 0.6178 | 1.0398 | 169 | 3m 43s | http://eclipse.gsfc.nasa.gov/5MCSEmap/2201-2300/2225-12-01.gif |
| 136 | 50 | December 12, 2243 | 11:52:14 | Total | 15.5N 9E | 0.6284 | 1.0365 | 157 | 3m 30s | http://eclipse.gsfc.nasa.gov/5MCSEmap/2201-2300/2243-12-12.gif |
| 136 | 51 | December 22, 2261 | 20:38:50 | Total | 16.1N 124.2W | 0.636 | 1.0337 | 147 | 3m 17s | http://eclipse.gsfc.nasa.gov/5MCSEmap/2201-2300/2261-12-22.gif |
| 136 | 52 | January 3, 2280 | 5:28:11 | Total | 17.2N 101.9E | 0.6414 | 1.0314 | 138 | 3m 4s | http://eclipse.gsfc.nasa.gov/5MCSEmap/2201-2300/2280-01-03.gif |
| 136 | 53 | January 13, 2298 | 14:16:27 | Total | 19N 31.9W | 0.6474 | 1.0296 | 131 | 2m 52s | http://eclipse.gsfc.nasa.gov/5MCSEmap/2201-2300/2298-01-13.gif |
| 136 | 54 | January 25, 2316 | 23:05:17 | Total | 21.4N 166W | 0.6526 | 1.0282 | 126 | 2m 42s | http://eclipse.gsfc.nasa.gov/5MCSEmap/2301-2400/2316-01-25.gif |
| 136 | 55 | February 5, 2334 | 7:50:29 | Total | 24.6N 60.8E | 0.6603 | 1.0272 | 122 | 2m 33s | http://eclipse.gsfc.nasa.gov/5MCSEmap/2301-2400/2334-02-05.gif |
| 136 | 56 | February 16, 2352 | 16:32:06 | Total | 28.5N 71.8W | 0.6709 | 1.0266 | 121 | 2m 25s | http://eclipse.gsfc.nasa.gov/5MCSEmap/2301-2400/2352-02-16.gif |
| 136 | 57 | February 27, 2370 | 1:07:02 | Total | 33.2N 157E | 0.6865 | 1.0262 | 121 | 2m 17s | http://eclipse.gsfc.nasa.gov/5MCSEmap/2301-2400/2370-02-27.gif |
| 136 | 58 | March 9, 2388 | 9:36:21 | Total | 38.5N 27E | 0.7064 | 1.026 | 124 | 2m 10s | http://eclipse.gsfc.nasa.gov/5MCSEmap/2301-2400/2388-03-09.gif |
| 136 | 59 | March 20, 2406 | 17:57:23 | Total | 44.5N 101.3W | 0.7327 | 1.0258 | 128 | 2m 3s | http://eclipse.gsfc.nasa.gov/5MCSEmap/2401-2500/2406-03-20.gif |
| 136 | 60 | March 31, 2424 | 2:10:10 | Total | 51.3N 131.9E | 0.7652 | 1.0254 | 133 | 1m 55s | http://eclipse.gsfc.nasa.gov/5MCSEmap/2401-2500/2424-03-31.gif |
| 136 | 61 | April 11, 2442 | 10:14:04 | Total | 58.7N 6.2E | 0.8046 | 1.0248 | 142 | 1m 45s | http://eclipse.gsfc.nasa.gov/5MCSEmap/2401-2500/2442-04-11.gif |
| 136 | 62 | April 21, 2460 | 18:09:49 | Total | 66.8N 119.8W | 0.8503 | 1.0236 | 154 | 1m 34s | http://eclipse.gsfc.nasa.gov/5MCSEmap/2401-2500/2460-04-21.gif |
| 136 | 63 | May 3, 2478 | 1:55:59 | Total | 75.7N 107.7E | 0.9034 | 1.0218 | 176 | 1m 20s | http://eclipse.gsfc.nasa.gov/5MCSEmap/2401-2500/2478-05-03.gif |
| 136 | 64 | May 13, 2496 | 9:34:25 | Total | 81N 70.4W | 0.9622 | 1.0185 | 243 | 1m 2s | http://eclipse.gsfc.nasa.gov/5MCSEmap/2401-2500/2496-05-13.gif |
| 136 | 65 | May 25, 2514 | 17:04:32 | Partial | 68.5N 123.2E | 1.0272 | 0.9507 | http://eclipse.gsfc.nasa.gov/5MCSEmap/2501-2600/2514-05-25.gif | ||
| 136 | 66 | June 5, 2532 | 0:28:58 | Partial | 67.5N 1.3E | 1.0962 | 0.8224 | http://eclipse.gsfc.nasa.gov/5MCSEmap/2501-2600/2532-06-05.gif | ||
| 136 | 67 | June 16, 2550 | 7:45:35 | Partial | 66.4N 118.1W | 1.1708 | 0.684 | http://eclipse.gsfc.nasa.gov/5MCSEmap/2501-2600/2550-06-16.gif | ||
| 136 | 68 | June 26, 2568 | 14:58:55 | Partial | 65.5N 123.7E | 1.2472 | 0.5426 | http://eclipse.gsfc.nasa.gov/5MCSEmap/2501-2600/2568-06-26.gif | ||
| 136 | 69 | July 7, 2586 | 22:07:07 | Partial | 64.5N 7.2E | 1.327 | 0.3957 | http://eclipse.gsfc.nasa.gov/5MCSEmap/2501-2600/2586-07-07.gif | ||
| 136 | 70 | July 19, 2604 | 5:14:31 | Partial | 63.7N 108.8W | 1.4062 | 0.2509 | http://eclipse.gsfc.nasa.gov/5MCSEmap/2601-2700/2604-07-19.gif | ||
| 136 | 71 | July 30, 2622 | 12:18:09 | Partial | 63N 136.4E | 1.4872 | 0.1039 | http://eclipse.gsfc.nasa.gov/5MCSEmap/2601-2700/2622-07-30.gif |
Animated path of entire Saros.