

Shock response spectrum
Encyclopedia
Shock (mechanics)
A mechanical or physical shock is a sudden acceleration or deceleration caused, for example, by impact, drop, kick, earthquake, or explosion. Shock is a transient physical excitation....
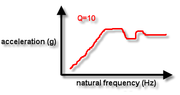
in terms of how a Single Degree Of Freedom (SDOF) system (like a mass on a spring) responds to that input. Actually, it shows the peak acceleration response of an infinite number of SDOFs, each of which have different natural frequencies. Acceleration response is represented on the y-axis, and natural frequency of any given SDOF is shown on the x-axis.
An SRS is generated from a shock waveform using the following process:
- Pick a damping ratio for your SRS to be based on
- Assume a hypothetical Single Degree of Freedom System (SDOF), with a damped natural frequency of xHz
- Calculate (by time base simulation or something more subtle) the maximum instantaneous absolute acceleration experienced by the mass element of your SDOFs at any time during (or after) exposure to the shock in question. Plot this in g's (g's are standard, but pick any unit of acceleration you want) against the frequency (x) of the hypothetical system.
- Repeat steps 2 and 3 for other values of X, say logarithmically up to 1000x.
The resulting plot of peak acceleration vs test system frequency is called a Shock Response Spectrum. The name is misleading because simply plotting a list of "something versus frequency" does not make it a spectral plot (no more than a chart showing your probability of bumping your head on the doorframe versus your height means there's a steady stream of heads being bumped).
Consider, for example, a computer chassis containing three cards with fundamental natural frequencies of aHz, bHz, and cHz, and a screen with a predicted frequency of dHz. The system is tested to a certain shock waveform (based on recorded data from the customer's application) in the lab. A new customer comes along, and you want to be able to determine whether or not the computer is likely to survive the shocks measured in their application. You could calculate the SRS of each shock, and check that in the neighbourhood of the card/screen's maximum sensitivities the new shock is lower than the old one, and that everywhere else it's not too much higher. If so, you've got a good indication that it's likely to survive.
Note the following:
Any transient waveform can be presented as an SRS, but the relationship is not unique; many different transient waveforms can produce the same SRS (something one can take advantage of through a process called "Shock Synthesis"). Due to only tracking the peak instantaneous acceleration the SRS does not contain all the information in the transient waveform from which it was created.
Different damping ratios produce different SRSs for the same shock waveform. Zero damping will produce a maximum response. Very high damping produces a very boring SRS (horizontal line). The level of damping is demonstrated by the "quality factor", Q which can also be thought of transmissibility in sinusoidal vibration case. Relative damping of 5% results in a Q of 10. An SRS plot is incomplete if it doesn't specify the assumed Q value.
An SRS is of little use for fatigue-type damage scenarios, as the transform removes information of how many times a peak acceleration (and inferred stress) is reached.
The SDOF system model also can be used to characterize the severity of vibrations, with two criteria:
- the exceeding of characteristic instantaneous stress limits (yield stress, ultimate stress etc.). We then define the extreme response spectrum
Extreme response spectrum
The Extreme Response Spectrum is defined as a curve giving the value of the highest peak of the response of a linear Single Degree of Freedom System to vibration, according to its natural frequency, for a given damping ratio...
(ERS), similar to the shock response spectrum;
– the damage by fatigue following the application of a large number of cycles, thus taking into account the duration of the vibration (Fatigue damage spectrum
Fatigue damage spectrum
The Fatigue Damage Spectrum of a vibration is obtained by tracing the fatigue damage experienced by a linear Single Degree of Freedom System according to its natural frequency, for given damping ratio and for a given value of parameter b .Regardless of the...
(FDS)).
Like many other useful tools, the SRS is not applicable to significantly non-linear systems.