
Self-organizing map
Encyclopedia
A self-organizing map or self-organizing feature map (SOFM) is a type of artificial neural network
that is trained using unsupervised learning
to produce a low-dimensional (typically two-dimensional), discretized representation of the input space of the training samples, called a map. Self-organizing maps are different from other artificial neural networks in the sense that they use a neighborhood function to preserve the topological
properties of the input space.
 This makes SOMs useful for visualizing
low-dimensional views of high-dimensional data, akin to multidimensional scaling
. The model was first described as an artificial neural network by the Finnish
professor Teuvo Kohonen
, and is sometimes called a Kohonen map.
Like most artificial neural networks, SOMs operate in two modes: training and mapping. Training builds the map using input examples. It is a competitive process, also called vector quantization
. Mapping automatically classifies a new input vector.
A self-organizing map consists of components called nodes or neurons. Associated with each node is a weight vector of the same dimension as the input data vectors and a position in the map space. The usual arrangement of nodes is a regular spacing in a hexagonal or rectangular grid. The self-organizing map describes a mapping from a higher dimensional input space to a lower dimensional map space. The procedure for placing a vector from data space onto the map is to first find the node with the closest weight vector to the vector taken from data space. Once the closest node is located it is assigned the values from the vector taken from the data space.
While it is typical to consider this type of network structure as related to feedforward networks
where the nodes are visualized as being attached, this type of architecture is fundamentally different in arrangement and motivation.
Useful extensions include using toroidal
grids where opposite edges are connected and using large numbers of nodes. It has been shown that while self-organizing maps with a small number of nodes behave in a way that is similar to K-means
, larger self-organizing maps rearrange data in a way that is fundamentally topological in character.
It is also common to use the U-Matrix
. The U-Matrix value of a particular node is the average distance between the node and its closest neighbors (ref. 9). In a square grid for instance, we might consider the closest 4 or 8 nodes (the Von Neumann neighborhood
and Moore neighborhood
respectively), or six nodes in a hexagonal grid.
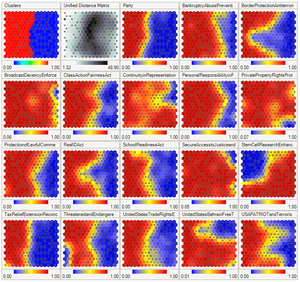
Large SOMs display properties which are emergent. In maps consisting of thousands of nodes, it is possible to perform cluster operations on the map itself.
information is handled in separate parts of the cerebral cortex
in the human brain
.
The weights of the neurons are initialized either to small random values or sampled evenly from the subspace spanned by the two largest principal component eigenvectors. With the latter alternative, learning is much faster because the initial weights already give good approximation of SOM weights.
The network must be fed a large number of example vectors that represent, as close as possible, the kinds of vectors expected during mapping. The examples are usually administered several times as iterations.
The training utilizes competitive learning
. When a training example is fed to the network, its Euclidean distance
to all weight vectors is computed. The neuron with weight vector most similar to the input is called the best matching unit (BMU). The weights of the BMU and neurons close to it in the SOM lattice are adjusted towards the input vector. The magnitude of the change decreases with time and with distance from the BMU. The update formula for a neuron with weight vector Wv(t) is
where α(t) is a monotonically decreasing learning coefficient and D(t) is the input vector. The neighborhood function Θ (v, t) depends on the lattice distance between the BMU and neuron v. In the simplest form it is one for all neurons close enough to BMU and zero for others, but a Gaussian function is a common choice, too. Regardless of the functional form, the neighborhood function shrinks with time. At the beginning when the neighborhood is broad, the self-organizing takes place on the global scale. When the neighborhood has shrunk to just a couple of neurons the weights are converging to local estimates.
This process is repeated for each input vector for a (usually large) number of cycles λ. The network winds up associating output nodes with groups or patterns in the input data set. If these patterns can be named, the names can be attached to the associated nodes in the trained net.
During mapping, there will be one single winning neuron: the neuron whose weight vector lies closest to the input vector. This can be simply determined by calculating the Euclidean distance between input vector and weight vector.
While representing input data as vectors has been emphasized in this article, it should be noted that any kind of object which can be represented digitally and which has an appropriate distance measure associated with it and in which the necessary operations for training are possible can be used to construct a self-organizing map. This includes matrices, continuous functions or even other self-organizing maps.
Now we need input to feed the map. (The generated map and the given input exist in separate subspaces.) We will create three vectors to represent colors. Colors can be represented by their red, green, and blue components. Consequently our input vectors will have three components, each corresponding to a color space. The input vectors will be:
The color training vector data sets used in SOM:
The data vectors should preferably be normalized (vector length is equal to one) before training the SOM.
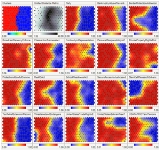
Neurons (40 x 40 square grid) are trained for 250 iterations with a learning rate of 0.1 using the normalized Iris flower data set
which has four dimensional data vectors. A color image formed by first three dimensions of the four dimensional SOM weight vectors (top left), pseudo-color image of the magnitude of the SOM weight vectors (top right), U-Matrix (Euclidean distance between weight vectors of neighboring cells) of the SOM (bottom left) and overlay of data points (red: I. setosa, green: I. versicolor and blue: I. verginica) on the U-Matrix based on the minimum Euclidean distance between data vectors and SOM weight vectors (bottom right).
(Euclidean distance between weight vectors of neighboring cells) of the SOM.
The other way is to think of neuronal weights as pointers to the input space. They form a discrete approximation of the distribution of training samples. More neurons point to regions with high training sample concentration and fewer where the samples are scarce.
SOM may be considered a nonlinear generalization of Principal components analysis
(PCA). It has been shown, using both artificial and real geophysical data, that SOM has many advantages over the conventional feature extraction methods such as Empirical Orthogonal Functions (EOF) or PCA.
Originally, SOM was not formulated as a solution to an optimisation problem. Nevertheless, there have been several attempts to modify the definition of SOM and to formulate an optimisation problem which gives similar results. For example, Elastic map
s use for approximation of principal manifolds
the mechanical metaphor of elasticity and analogy of the map with elastic membrane and plate.
Large Memory Storage and Retrieval (LAMSTAR) neural networks are SOM-based neural networks that can employ a very large number of SOM layers of differing number of neurons to store the LAMSTAR's input sub-words of an input word. The LAMSTAR also employs one or more output (decision) SOM layers and a multitude of link-weights connecting the winning neurons of the various input layers to the decision layers. The link-weights from all winning input layers to a given output lay SOM module are summed. The winning decision is that with the highest link-weight total. Initial weights are all set to zero. The network is fully transparent since the link-weights give the relative significance of a given input layer (sub-word) or even of any input neuron, relative to a given decision. The Lamstar has a forgetting capability, subject to a pre-assigned forgetting factor. Weights are continuously learnt (updated) by punishments and rewards that are added/subtracted to/from each link weight of any winning input neuron after each run or iteration of the input data. The network was developed by Daniel Graupe, Hubert Kordylewsky and Nathan Schneider. See: D Graupe, Principles of Artificial Neural Networks, 2nd edition, World Scientific Publishers, 2007. The LAMSTAR has been used in many applications involving large and diverse data sets ranging from medical diagnosis, economics, finance, cyber security and beyond,
A special type of Kohonen SOM is the Hybrid Kohonen Self Organizing Map where the network architecture consists of an input layer fully connected to a 2–D SOM or Kohonen layer. The output from the Kohonen layer, which is the winning neuron feeds into a hidden layer and finally into an output layer. In other words, the Kohonen SOM is the front–end, while the hidden and output layer of a MLP is the back–end of the
Hybrid Kohonen SOM. The Hybrid Kohonen SOM was first applied to machine vision systems for image classification and recognition.
See: F. Nabhani and T. Shaw. Performance analysis and optimisation of shape recognition and classification using ANN. Robotics and Computer
Integrated Manufacturing, 18:177–185, 2002. Hybrid Kohonen SOM has been used in weather prediction and especially in forecasting stock prices, which has made such a challenging task considerably easier. It is fast and efficient with less classification error, hence, a better predictor compared to Kohonen SOM and Backpropagation networks.
Artificial neural network
An artificial neural network , usually called neural network , is a mathematical model or computational model that is inspired by the structure and/or functional aspects of biological neural networks. A neural network consists of an interconnected group of artificial neurons, and it processes...
that is trained using unsupervised learning
Unsupervised learning
In machine learning, unsupervised learning refers to the problem of trying to find hidden structure in unlabeled data. Since the examples given to the learner are unlabeled, there is no error or reward signal to evaluate a potential solution...
to produce a low-dimensional (typically two-dimensional), discretized representation of the input space of the training samples, called a map. Self-organizing maps are different from other artificial neural networks in the sense that they use a neighborhood function to preserve the topological
Topology
Topology is a major area of mathematics concerned with properties that are preserved under continuous deformations of objects, such as deformations that involve stretching, but no tearing or gluing...
properties of the input space.
Scientific visualization
Scientific visualization is an interdisciplinary branch of science according to Friendly "primarily concerned with the visualization of three-dimensional phenomena , where the emphasis is on realistic renderings of volumes, surfaces, illumination sources, and so forth, perhaps...
low-dimensional views of high-dimensional data, akin to multidimensional scaling
Multidimensional scaling
Multidimensional scaling is a set of related statistical techniques often used in information visualization for exploring similarities or dissimilarities in data. MDS is a special case of ordination. An MDS algorithm starts with a matrix of item–item similarities, then assigns a location to each...
. The model was first described as an artificial neural network by the Finnish
Finland
Finland , officially the Republic of Finland, is a Nordic country situated in the Fennoscandian region of Northern Europe. It is bordered by Sweden in the west, Norway in the north and Russia in the east, while Estonia lies to its south across the Gulf of Finland.Around 5.4 million people reside...
professor Teuvo Kohonen
Teuvo Kohonen
Teuvo Kohonen, Dr. Ing , is a Finnish academician and prominent researcher. He is currently professor emeritus of the Academy of Finland.Prof...
, and is sometimes called a Kohonen map.
Like most artificial neural networks, SOMs operate in two modes: training and mapping. Training builds the map using input examples. It is a competitive process, also called vector quantization
Vector quantization
Vector quantization is a classical quantization technique from signal processing which allows the modeling of probability density functions by the distribution of prototype vectors. It was originally used for data compression. It works by dividing a large set of points into groups having...
. Mapping automatically classifies a new input vector.
A self-organizing map consists of components called nodes or neurons. Associated with each node is a weight vector of the same dimension as the input data vectors and a position in the map space. The usual arrangement of nodes is a regular spacing in a hexagonal or rectangular grid. The self-organizing map describes a mapping from a higher dimensional input space to a lower dimensional map space. The procedure for placing a vector from data space onto the map is to first find the node with the closest weight vector to the vector taken from data space. Once the closest node is located it is assigned the values from the vector taken from the data space.
While it is typical to consider this type of network structure as related to feedforward networks
Feedforward neural networks
A feedforward neural network is an artificial neural network where connections between the units do not form a directed cycle. This is different from recurrent neural networks....
where the nodes are visualized as being attached, this type of architecture is fundamentally different in arrangement and motivation.
Useful extensions include using toroidal
Torus
In geometry, a torus is a surface of revolution generated by revolving a circle in three dimensional space about an axis coplanar with the circle...
grids where opposite edges are connected and using large numbers of nodes. It has been shown that while self-organizing maps with a small number of nodes behave in a way that is similar to K-means
K-means algorithm
In statistics and data mining, k-means clustering is a method of cluster analysis which aims to partition n observations into k clusters in which each observation belongs to the cluster with the nearest mean...
, larger self-organizing maps rearrange data in a way that is fundamentally topological in character.
It is also common to use the U-Matrix
U-Matrix
The U-Matrix is a representation of a self organizing map where the Euclidean distance between the codebook vector of the neighboring neurons is depicted in a gray scale image...
. The U-Matrix value of a particular node is the average distance between the node and its closest neighbors (ref. 9). In a square grid for instance, we might consider the closest 4 or 8 nodes (the Von Neumann neighborhood
Von Neumann neighborhood
In cellular automata, the von Neumann neighborhood comprises the four cells orthogonally surrounding a central cell on a two-dimensional square lattice. The neighborhood is named after John von Neumann, who used it for his pioneering cellular automata including the Universal Constructor...
and Moore neighborhood
Moore neighborhood
In cellular automata, the Moore neighborhood comprises the eight cells surrounding a central cell on a two-dimensional square lattice. The neighborhood is named after Edward F. Moore, a pioneer of cellular automata theory. It is one of the two most commonly used neighborhood types, the other one...
respectively), or six nodes in a hexagonal grid.
Large SOMs display properties which are emergent. In maps consisting of thousands of nodes, it is possible to perform cluster operations on the map itself.
Learning algorithm
The goal of learning in the self-organizing map is to cause different parts of the network to respond similarly to certain input patterns. This is partly motivated by how visual, auditory or other sensorySense
Senses are physiological capacities of organisms that provide inputs for perception. The senses and their operation, classification, and theory are overlapping topics studied by a variety of fields, most notably neuroscience, cognitive psychology , and philosophy of perception...
information is handled in separate parts of the cerebral cortex
Cerebral cortex
The cerebral cortex is a sheet of neural tissue that is outermost to the cerebrum of the mammalian brain. It plays a key role in memory, attention, perceptual awareness, thought, language, and consciousness. It is constituted of up to six horizontal layers, each of which has a different...
in the human brain
Human brain
The human brain has the same general structure as the brains of other mammals, but is over three times larger than the brain of a typical mammal with an equivalent body size. Estimates for the number of neurons in the human brain range from 80 to 120 billion...
.
The weights of the neurons are initialized either to small random values or sampled evenly from the subspace spanned by the two largest principal component eigenvectors. With the latter alternative, learning is much faster because the initial weights already give good approximation of SOM weights.
The network must be fed a large number of example vectors that represent, as close as possible, the kinds of vectors expected during mapping. The examples are usually administered several times as iterations.
The training utilizes competitive learning
Competitive learning
Competitive learning is a form of unsupervised learning in artificial neural networks, in which nodes compete for the right to respond to a subset of the input data. A variant of Hebbian learning, competitive learning works by increasing the specialization of each node in the network...
. When a training example is fed to the network, its Euclidean distance
Euclidean distance
In mathematics, the Euclidean distance or Euclidean metric is the "ordinary" distance between two points that one would measure with a ruler, and is given by the Pythagorean formula. By using this formula as distance, Euclidean space becomes a metric space...
to all weight vectors is computed. The neuron with weight vector most similar to the input is called the best matching unit (BMU). The weights of the BMU and neurons close to it in the SOM lattice are adjusted towards the input vector. The magnitude of the change decreases with time and with distance from the BMU. The update formula for a neuron with weight vector Wv(t) is
- Wv(t + 1) = Wv(t) + Θ (v, t) α(t)(D(t) - Wv(t)),
where α(t) is a monotonically decreasing learning coefficient and D(t) is the input vector. The neighborhood function Θ (v, t) depends on the lattice distance between the BMU and neuron v. In the simplest form it is one for all neurons close enough to BMU and zero for others, but a Gaussian function is a common choice, too. Regardless of the functional form, the neighborhood function shrinks with time. At the beginning when the neighborhood is broad, the self-organizing takes place on the global scale. When the neighborhood has shrunk to just a couple of neurons the weights are converging to local estimates.
This process is repeated for each input vector for a (usually large) number of cycles λ. The network winds up associating output nodes with groups or patterns in the input data set. If these patterns can be named, the names can be attached to the associated nodes in the trained net.
During mapping, there will be one single winning neuron: the neuron whose weight vector lies closest to the input vector. This can be simply determined by calculating the Euclidean distance between input vector and weight vector.
While representing input data as vectors has been emphasized in this article, it should be noted that any kind of object which can be represented digitally and which has an appropriate distance measure associated with it and in which the necessary operations for training are possible can be used to construct a self-organizing map. This includes matrices, continuous functions or even other self-organizing maps.
Preliminary definitions
Consider a n×m array of nodes each of which contains a weight vector and is aware of its location in the array. Each weight vector is of the same dimension as the node's input vector. The weights may initially be set to random values.Now we need input to feed the map. (The generated map and the given input exist in separate subspaces.) We will create three vectors to represent colors. Colors can be represented by their red, green, and blue components. Consequently our input vectors will have three components, each corresponding to a color space. The input vectors will be:
- R = <255, 0, 0>
- G = <0, 255, 0>
- B = <0, 0, 255>
The color training vector data sets used in SOM:
- threeColors = [255, 0, 0], [0, 255, 0], [0, 0, 255]
- eightColors = [0, 0, 0], [255, 0, 0], [0, 255, 0], [0, 0, 255], [255, 255, 0], [0, 255, 255], [255, 0, 255], [255, 255, 255]
The data vectors should preferably be normalized (vector length is equal to one) before training the SOM.
Neurons (40 x 40 square grid) are trained for 250 iterations with a learning rate of 0.1 using the normalized Iris flower data set
Iris flower data set
The Iris flower data set or Fisher's Iris data set is a multivariate data set introduced by Sir Ronald Aylmer Fisher as an example of discriminant analysis...
which has four dimensional data vectors. A color image formed by first three dimensions of the four dimensional SOM weight vectors (top left), pseudo-color image of the magnitude of the SOM weight vectors (top right), U-Matrix (Euclidean distance between weight vectors of neighboring cells) of the SOM (bottom left) and overlay of data points (red: I. setosa, green: I. versicolor and blue: I. verginica) on the U-Matrix based on the minimum Euclidean distance between data vectors and SOM weight vectors (bottom right).
Variables
These are the variables needed, with vectors in bold,-
 denotes current iteration
 -
 is the limit on time iteration
 -
 is the current weight vector
 -
 is the target input
 -
 is restraint due to distance from BMU, usually called the neighborhood function, and
 -
 is learning restraint due to time.
Algorithm
- Randomize the map's nodes' weight vectors
- Grab an input vector
- Traverse each node in the map
- Use Euclidean distanceEuclidean distanceIn mathematics, the Euclidean distance or Euclidean metric is the "ordinary" distance between two points that one would measure with a ruler, and is given by the Pythagorean formula. By using this formula as distance, Euclidean space becomes a metric space...
formula to find similarity between the input vector and the map's node's weight vector - Track the node that produces the smallest distance (this node is the best matching unit, BMU)
- Use Euclidean distance
- Update the nodes in the neighborhood of BMU by pulling them closer to the input vector
- Wv(t + 1) = Wv(t) + Θ(t)α(t)(D(t) - Wv(t))
- Increase t and repeat from 2 while

Interpretation
There are two ways to interpret a SOM. Because in the training phase weights of the whole neighborhood are moved in the same direction, similar items tend to excite adjacent neurons. Therefore, SOM forms a semantic map where similar samples are mapped close together and dissimilar apart. This may be visualized by a U-MatrixU-Matrix
The U-Matrix is a representation of a self organizing map where the Euclidean distance between the codebook vector of the neighboring neurons is depicted in a gray scale image...
(Euclidean distance between weight vectors of neighboring cells) of the SOM.
The other way is to think of neuronal weights as pointers to the input space. They form a discrete approximation of the distribution of training samples. More neurons point to regions with high training sample concentration and fewer where the samples are scarce.
SOM may be considered a nonlinear generalization of Principal components analysis
Principal components analysis
Principal component analysis is a mathematical procedure that uses an orthogonal transformation to convert a set of observations of possibly correlated variables into a set of values of uncorrelated variables called principal components. The number of principal components is less than or equal to...
(PCA). It has been shown, using both artificial and real geophysical data, that SOM has many advantages over the conventional feature extraction methods such as Empirical Orthogonal Functions (EOF) or PCA.
Originally, SOM was not formulated as a solution to an optimisation problem. Nevertheless, there have been several attempts to modify the definition of SOM and to formulate an optimisation problem which gives similar results. For example, Elastic map
Elastic map
Elastic maps provide a tool for nonlinear dimensionality reduction. By their construction, they are system of elastic springs embedded in the dataspace. This system approximates a low-dimensional manifold...
s use for approximation of principal manifolds
the mechanical metaphor of elasticity and analogy of the map with elastic membrane and plate.
Alternatives
- The generative topographic mapGenerative Topographic MapGenerative topographic map is a machine learning method that is a probabilistic counterpart of the self-organizing map , is provably convergent and does not require a shrinking neighborhood or a decreasing step size...
(GTM) is a potential alternative to SOMs. In the sense that a GTM explicitly requires a smooth and continuous mapping from the input space to the map space, it is topology preserving. However, in a practical sense, this measure of topological preservation is lacking.
- The time adaptive self-organizing map (TASOM) network is an extension of the basic SOM. The TASOM employs adaptive learning rates and neighborhood functions. It also includes a scaling parameter to make the network invariant to scaling, translation and rotation of the input space. The TASOM and its variants have been used in several applications including adaptive clustering, multilevel thresholding, input space approximation, and active contour modeling.. Moreover, a Binary Tree TASOM or BTASOM, resembling a binary natural tree having nodes composed of TASOM networks has been proposed where the number of its levels and the number of its nodes are adaptive with its environment.
- The growing self-organizing mapGrowing self-organizing mapA growing self-organizing map is a growing variant of the popular self-organizing map . The GSOM was developed to address the issue of identifying a suitable map size in the SOM. It starts with a minimal number of nodes and grows new nodes on the boundary based on a heuristic...
(GSOM) is a growing variant of the self-organizing map. The GSOM was developed to address the issue of identifying a suitable map size in the SOM. It starts with a minimal number of nodes (usually four) and grows new nodes on the boundary based on a heuristic. By using a value called the spread factor, the data analyst has the ability to control the growth of the GSOM.
See also
- Neural gasNeural gasNeural gas is an artificial neural network, inspired by the self-organizing map and introduced in 1991 by Thomas Martinetz and Klaus Schulten. The neural gas is a simple algorithm for finding optimal data representations based on feature vectors...
- Large Memory Storage and Retrieval (LAMSTAR) neural networks:
Large Memory Storage and Retrieval (LAMSTAR) neural networks are SOM-based neural networks that can employ a very large number of SOM layers of differing number of neurons to store the LAMSTAR's input sub-words of an input word. The LAMSTAR also employs one or more output (decision) SOM layers and a multitude of link-weights connecting the winning neurons of the various input layers to the decision layers. The link-weights from all winning input layers to a given output lay SOM module are summed. The winning decision is that with the highest link-weight total. Initial weights are all set to zero. The network is fully transparent since the link-weights give the relative significance of a given input layer (sub-word) or even of any input neuron, relative to a given decision. The Lamstar has a forgetting capability, subject to a pre-assigned forgetting factor. Weights are continuously learnt (updated) by punishments and rewards that are added/subtracted to/from each link weight of any winning input neuron after each run or iteration of the input data. The network was developed by Daniel Graupe, Hubert Kordylewsky and Nathan Schneider. See: D Graupe, Principles of Artificial Neural Networks, 2nd edition, World Scientific Publishers, 2007. The LAMSTAR has been used in many applications involving large and diverse data sets ranging from medical diagnosis, economics, finance, cyber security and beyond,
- Hybrid Kohonen SOM
A special type of Kohonen SOM is the Hybrid Kohonen Self Organizing Map where the network architecture consists of an input layer fully connected to a 2–D SOM or Kohonen layer. The output from the Kohonen layer, which is the winning neuron feeds into a hidden layer and finally into an output layer. In other words, the Kohonen SOM is the front–end, while the hidden and output layer of a MLP is the back–end of the
Hybrid Kohonen SOM. The Hybrid Kohonen SOM was first applied to machine vision systems for image classification and recognition.
See: F. Nabhani and T. Shaw. Performance analysis and optimisation of shape recognition and classification using ANN. Robotics and Computer
Integrated Manufacturing, 18:177–185, 2002. Hybrid Kohonen SOM has been used in weather prediction and especially in forecasting stock prices, which has made such a challenging task considerably easier. It is fast and efficient with less classification error, hence, a better predictor compared to Kohonen SOM and Backpropagation networks.
External links
- Self-organizing maps for WEKA: Implementation of Self-organizing maps in Java, for the WEKA Machine Learning Workbench.
- Self-organizing maps for Ruby: Implementation of Self-organizing maps in Ruby, for the AI4R project.
- Spice-SOM: A free GUI application of Self-Organizing Map
- IFCSoft: An open-source Java platform for generating Self-Organizing Maps