

Power graph analysis
Encyclopedia
In computational biology
, power graph analysis is a method for the analysis and
representation of complex network
s. Power graph analysis is the computation, analysis and visual representation of a power graph from a graphs
(networks).
Power graph analysis can be thought of as a lossless
compression algorithm for graphs. It extends graph syntax with representations of cliques
, bicliques
and stars. Compression levels of up to 95% have been obtained for complex biological networks.
Hypergraph
s are a generalization of graphs in which edges are not just couples of nodes but arbitrary n-tuples. Power Graphs are not another generalization of graphs, but instead a novel representation of graphs that proposes a shift from the "node and edge" language to an using cliques, bicliques and stars as primitives.

Bicliques
are two sets of nodes with an edge between every member of one set and every member of the other set. In a power graph, a biclique is represented as an edge between two power nodes.
Cliques
are a set of nodes with an edge between every pair of nodes. In a power graph, a clique is represented by a power node with a loop
.
Stars are a set of nodes with an edge between every member of that set and a single node outside the set. In a power graph, a star is represented by a power edge between a regular node and a power node.
 where
where  is the set of nodes and
  is the set of edges, a power graph
  is a graph defined on the power set
  of power nodes connected to each other by power edges:
  . Hence power graphs are defined on the power set of nodes as well as on the power set of edges of the graph
  .
.
The semantics of power graphs are as follows: if two power nodes are connected by a power edge, this means that all nodes of the first power node are connected to all nodes of the second power node. Similarly, if a power node is connected to itself by a power edge, this signifies that all nodes in the power node are connected to each other by edges.
The following two conditions are required:
can be seen as a rewriting of the function in terms of harmonic functions instead of
 pairs. This transformation changes the point of view from time domain
to frequency domain and enables many interesting applications in signal analysis, data compression
,
and filtering.
Similarly, Power Graph Analysis is a rewriting or decomposition of a network using bicliques, cliques and stars
as primitive elements (just as harmonic functions for Fourier analysis).
It can be used to analyze, compress and filter networks.
There are, however, several key differences. First, in Fourier analysis the two spaces (time and frequency domains)
are the same function space - but stricto sensu, power graphs are not graphs.
Second, there is not a unique power graph representing a given graph. Yet a very interesting class of power graphs
are minimal power graphs which have the least number of power edges and power nodes necessary to represent a given graph.
 In general, there is no unique minimal power graph for a given graph.
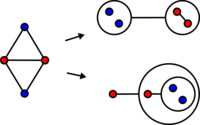
In this example (right) a graph of four nodes and five edges admits two minimal power graphs of two power edges each.
The main difference between these two minimal power graphs is the higher nesting level of the second power graph as well as a loss of symmetry with respect to the underlying graph.
Loss of symmetry is only a problem in small toy examples since complex networks rarely exhibit such symmetries in the first place.
Additionally, one can minimize the nesting level but even then, there is in general not a unique minimal power graph of minimal nesting level.
The first step identifies candidate power nodes through a hierarchical clustering
of the nodes in the network
based on the similarity of their neighboring nodes. The similarity of two sets of neighbors is taken as the Jaccard index
of the two sets.
The second step performs a greedy search for possible power edges between candidate power nodes.
Power edges abstracting the most edges in the original network are added first to the power graph.
Thus bicliques, cliques and stars are incrementally replaced with power edges, until all remaining single edges are also added.
Candidate power nodes that are not the end point of any power edge are ignored.
can be used to compute a power graph by using
the strong modules of the modular decomposition.
Modules in modular decomposition are groups of nodes in a graph that
have identical neighbors. A Strong Module is a module that does not overlap
with another module.
However, in complex networks strong modules are more the exception than the
rule. Therefore the power graphs obtained through modular decomposition are far
from minimality.
The main difference between modular decomposition and power graph analysis is the
emphasis of power graph analysis in decomposing graphs not only using modules of nodes
but also modules of edges (cliques, bicliques). Indeed, power graph analysis can be seen as a loss-less
simultaneous clustering of both nodes and edges.
networks, domain-peptide binding motifs, Gene regulatory networks and Homology/Paralogy networks.
Computational biology
Computational biology involves the development and application of data-analytical and theoretical methods, mathematical modeling and computational simulation techniques to the study of biological, behavioral, and social systems...
, power graph analysis is a method for the analysis and
representation of complex network
Complex network
In the context of network theory, a complex network is a graph with non-trivial topological features—features that do not occur in simple networks such as lattices or random graphs but often occur in real graphs...
s. Power graph analysis is the computation, analysis and visual representation of a power graph from a graphs
Graph (mathematics)
In mathematics, a graph is an abstract representation of a set of objects where some pairs of the objects are connected by links. The interconnected objects are represented by mathematical abstractions called vertices, and the links that connect some pairs of vertices are called edges...
(networks).
Power graph analysis can be thought of as a lossless
Lossless data compression
Lossless data compression is a class of data compression algorithms that allows the exact original data to be reconstructed from the compressed data. The term lossless is in contrast to lossy data compression, which only allows an approximation of the original data to be reconstructed, in exchange...
compression algorithm for graphs. It extends graph syntax with representations of cliques
Clique (graph theory)
In the mathematical area of graph theory, a clique in an undirected graph is a subset of its vertices such that every two vertices in the subset are connected by an edge. Cliques are one of the basic concepts of graph theory and are used in many other mathematical problems and constructions on graphs...
, bicliques
Complete bipartite graph
In the mathematical field of graph theory, a complete bipartite graph or biclique is a special kind of bipartite graph where every vertex of the first set is connected to every vertex of the second set.- Definition :...
and stars. Compression levels of up to 95% have been obtained for complex biological networks.
Hypergraph
Hypergraph
In mathematics, a hypergraph is a generalization of a graph, where an edge can connect any number of vertices. Formally, a hypergraph H is a pair H = where X is a set of elements, called nodes or vertices, and E is a set of non-empty subsets of X called hyperedges or links...
s are a generalization of graphs in which edges are not just couples of nodes but arbitrary n-tuples. Power Graphs are not another generalization of graphs, but instead a novel representation of graphs that proposes a shift from the "node and edge" language to an using cliques, bicliques and stars as primitives.
Power graphs
Graphical representation
Graphs are drawn with circles or points that represent nodes and lines connecting pairs of nodes that represent edges. Power graphs extend the syntax of graphs with power nodes, which are drawn as a circle enclosing nodes or other power nodes, and power edges, which are lines between power nodes.Bicliques
Complete bipartite graph
In the mathematical field of graph theory, a complete bipartite graph or biclique is a special kind of bipartite graph where every vertex of the first set is connected to every vertex of the second set.- Definition :...
are two sets of nodes with an edge between every member of one set and every member of the other set. In a power graph, a biclique is represented as an edge between two power nodes.
Cliques
Clique (graph theory)
In the mathematical area of graph theory, a clique in an undirected graph is a subset of its vertices such that every two vertices in the subset are connected by an edge. Cliques are one of the basic concepts of graph theory and are used in many other mathematical problems and constructions on graphs...
are a set of nodes with an edge between every pair of nodes. In a power graph, a clique is represented by a power node with a loop
Loop (graph theory)
In graph theory, a loop is an edge that connects a vertex to itself. A simple graph contains no loops....
.
Stars are a set of nodes with an edge between every member of that set and a single node outside the set. In a power graph, a star is represented by a power edge between a regular node and a power node.
Formal definition
Given a graph where is the set of nodes and is the set of edges, a power graph is a graph defined on the power set of power nodes connected to each other by power edges: . Hence power graphs are defined on the power set of nodes as well as on the power set of edges of the graph .The semantics of power graphs are as follows: if two power nodes are connected by a power edge, this means that all nodes of the first power node are connected to all nodes of the second power node. Similarly, if a power node is connected to itself by a power edge, this signifies that all nodes in the power node are connected to each other by edges.
The following two conditions are required:
- Power node hierarchy condition: Any two power nodes are either disjoint, or one is included in the other.
- Power edge disjointness condition: There is an onto mappingSurjective functionIn mathematics, a function f from a set X to a set Y is surjective , or a surjection, if every element y in Y has a corresponding element x in X so that f = y...
from edges of the original graph to power edges.
Analogy to Fourier analysis
The Fourier analysis of a functioncan be seen as a rewriting of the function in terms of harmonic functions instead of
pairs. This transformation changes the point of view from time domainto frequency domain and enables many interesting applications in signal analysis, data compression
Data compression
In computer science and information theory, data compression, source coding or bit-rate reduction is the process of encoding information using fewer bits than the original representation would use....
,
and filtering.
Similarly, Power Graph Analysis is a rewriting or decomposition of a network using bicliques, cliques and stars
as primitive elements (just as harmonic functions for Fourier analysis).
It can be used to analyze, compress and filter networks.
There are, however, several key differences. First, in Fourier analysis the two spaces (time and frequency domains)
are the same function space - but stricto sensu, power graphs are not graphs.
Second, there is not a unique power graph representing a given graph. Yet a very interesting class of power graphs
are minimal power graphs which have the least number of power edges and power nodes necessary to represent a given graph.
Minimal power graphs
In this example (right) a graph of four nodes and five edges admits two minimal power graphs of two power edges each.
The main difference between these two minimal power graphs is the higher nesting level of the second power graph as well as a loss of symmetry with respect to the underlying graph.
Loss of symmetry is only a problem in small toy examples since complex networks rarely exhibit such symmetries in the first place.
Additionally, one can minimize the nesting level but even then, there is in general not a unique minimal power graph of minimal nesting level.
Power graph greedy algorithm
The power graph greedy algorithm relies on two simple steps to perform the decomposition:The first step identifies candidate power nodes through a hierarchical clustering
Hierarchical clustering
In statistics, hierarchical clustering is a method of cluster analysis which seeks to build a hierarchy of clusters. Strategies for hierarchical clustering generally fall into two types:...
of the nodes in the network
based on the similarity of their neighboring nodes. The similarity of two sets of neighbors is taken as the Jaccard index
Jaccard index
The Jaccard index, also known as the Jaccard similarity coefficient , is a statistic used for comparing the similarity and diversity of sample sets....
of the two sets.
The second step performs a greedy search for possible power edges between candidate power nodes.
Power edges abstracting the most edges in the original network are added first to the power graph.
Thus bicliques, cliques and stars are incrementally replaced with power edges, until all remaining single edges are also added.
Candidate power nodes that are not the end point of any power edge are ignored.
Modular decomposition
Modular decompositionModular decomposition
In graph theory, the modular decomposition is a decomposition of an undirected graph into subsets of vertices called modules. A module is a generalization of a connected component of a graph. Unlike connected components, however, one module can be a proper subset of another...
can be used to compute a power graph by using
the strong modules of the modular decomposition.
Modules in modular decomposition are groups of nodes in a graph that
have identical neighbors. A Strong Module is a module that does not overlap
with another module.
However, in complex networks strong modules are more the exception than the
rule. Therefore the power graphs obtained through modular decomposition are far
from minimality.
The main difference between modular decomposition and power graph analysis is the
emphasis of power graph analysis in decomposing graphs not only using modules of nodes
but also modules of edges (cliques, bicliques). Indeed, power graph analysis can be seen as a loss-less
simultaneous clustering of both nodes and edges.
Applications
Power Graph Analysis has been showed to be useful for the analysis of several types of biological networks such as Protein-protein interactionProtein-protein interaction
Protein–protein interactions occur when two or more proteins bind together, often to carry out their biological function. Many of the most important molecular processes in the cell such as DNA replication are carried out by large molecular machines that are built from a large number of protein...
networks, domain-peptide binding motifs, Gene regulatory networks and Homology/Paralogy networks.
See also
- Computational biologyComputational biologyComputational biology involves the development and application of data-analytical and theoretical methods, mathematical modeling and computational simulation techniques to the study of biological, behavioral, and social systems...
- Networks/GraphGraph (mathematics)In mathematics, a graph is an abstract representation of a set of objects where some pairs of the objects are connected by links. The interconnected objects are represented by mathematical abstractions called vertices, and the links that connect some pairs of vertices are called edges...
- Complex networks
- Modular decompositionModular decompositionIn graph theory, the modular decomposition is a decomposition of an undirected graph into subsets of vertices called modules. A module is a generalization of a connected component of a graph. Unlike connected components, however, one module can be a proper subset of another...
External links
- http://www.biotec.tu-dresden.de/schroeder/group/powergraphs Power Graph Analysis tools and example applications
- http://www.ploscompbiol.org/doi/pcbi.1000108 Power graph Analysis paper published in PLoS Computational Biology