
OPTICS algorithm
Encyclopedia
OPTICS is an algorithm for finding density-based clusters in spatial data. It was presented by Mihael Ankerst, Markus M. Breunig, Hans-Peter Kriegel
and Jörg Sander.
Its basic idea is similar to DBSCAN
, but it addresses one of DBSCAN's major weaknesses: the problem of detecting meaningful clusters in data of varying density. In order to do so, the points of the database are (linearly) ordered such that points which are spatially closest become neighbors in the ordering. Additionally, a special distance is stored for each point that represents the density that needs to be accepted for a cluster in order to have both points belong to the same cluster. This is represented as a dendrogram
.
, OPTICS requires two parameters: , which describes the maximum distance (radius) to consider, and
  , describing the number of points required to form a cluster. A point
  is a core point if at least
  points are found within its
  -neighborhood
  . Contrary to DBSCAN
, OPTICS also considers points that are part of a more densely packed cluster, so each point is assigned a core distance that basically describes the distance to its th point:

The reachability-distance of a point from another point
  is the distance between
  and
and  , or the core distance of
  :
:

Basically, if and
and  are nearest neighbors, this is the
  we need to assume in order to have
  and
and  belong to the same cluster.
Both the core-distance and the reachability-distance are undefined if no sufficiently dense cluster (w.r.t. ) is available. Given a sufficiently large
  , this will never happen, but then every
  -neighborhood query will return the entire database, resulting in
  runtime. Hence, the
  parameter is required to cut off the density of clusters that is no longer considered to be interesting and to speed up the algorithm this way.
The parameter is strictly speaking not necessary. It can be set to a maximum value. When a spatial index is available, it does however play a practical role when it comes to complexity. It is often claimed that OPTICS abstracts from DBSCAN by removing this parameter, at least to the amount of only having to give a maximum value.
, but instead of maintaining a set of known, but so far unprocessed cluster members, a priority queue
(e.g. using an indexed heap
) is used.
OPTICS(DB, eps, MinPts)
for each point p of DB
p.reachability-distance = UNDEFINED
for each unprocessed point p of DB
N = getNeighbors(p, eps)
mark p as processed
output p to the ordered list
Seeds = empty priority queue
if (core-distance(p, eps, Minpts) != UNDEFINED)
update(N, p, Seeds, eps, Minpts)
for each next q in Seeds
N' = getNeighbors(q, eps)
mark q as processed
output q to the ordered list
if (core-distance(q, eps, Minpts) != UNDEFINED)
update(N', q, Seeds, eps, Minpts)
In update, the priority queue Seeds is updated with the -neighborhood of
  and
and  , respectively:
update(N, p, Seeds, eps, Minpts)
coredist = core-distance(p, eps, MinPts)
for each o in N
if (o is not processed)
new-reach-dist = max(coredist, dist(p,o))
if (o.reachability-distance UNDEFINED) // o is not in Seeds
o.reachability-distance = new-reach-dist
Seeds.insert(o, new-reach-dist)
else // o in Seeds, check for improvement
if (new-reach-dist < o.reachability-distance)
o.reachability-distance = new-reach-dist
Seeds.move-up(o, new-reach-dist)
OPTICS hence outputs the points in a particular ordering, annotated with their smallest reachability distance (in the original algorithm, the core distance is also exported, but this is not required for further processing).
Extracting the Clusters
 Using a reachability-plot (a special kind of dendrogram
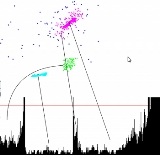
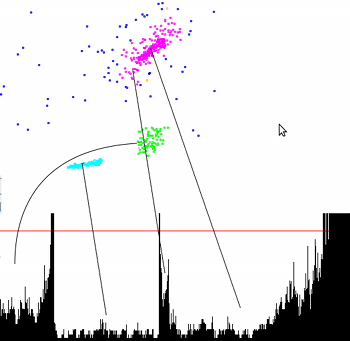
), the hierarchical structure of the clusters can be obtained easily. It is a 2D plot, with the ordering of the points on the x-axis and the reachability distance on the y-axis. Since points belonging to a cluster have a low reachability distance to their nearest neighbor, the clusters show up as valleys in the reachability plot. The deeper the valley, the denser the cluster.
The image on the right illustrates this concept. In its upper half, an artificial example of a database consisting of two-dimensional, spatial points is shown. The lower part shows the reachability plot as computed by OPTICS. The black lines link some clusters to their respective valleys. The horizontal red line is an example on how to obtain a clustering. Each valley it crosses is made a cluster of its own. If the line was moved down, more clusters would emerge, especially for the topmost cluster, which features varying densities.
Note that deriving clusters in such a way yields the same result on core points of running DBSCAN
on the data with set to the chosen reachability-distance threshold. The assignment of non-core points to neighboring clusters is non-deterministic in DBSCAN, too.
The blue points in this image are considered noise, and no valley is found in their reachability plot. This is subject to the parameter, which bounds the density of clusters.
A more advanced analysis does not use a specific value of , but instead looks for spikes that separate clusters. This can be used to obtain a hierarchical clustering
that cannot be achieved by a single DBSCAN run.
Complexity
Like DBSCAN
, OPTICS processes each point once, and performs one -neighborhood query during this processing. Given a spatial index that grants a neighborhood query in
  runtime, an overall runtime of
  is obtained. The authors of the original OPTICS paper report an actual constant slowdown factor of 1.6 compared to DBSCAN. Note that the value of
  might heavily influence the cost of the algorithm, since a value too large might raise the cost of a neighborhood query to linear complexity.
In particular, choosing (larger than the maximum distance in the data set) is possible, but will obviously lead to quadratic complexity, since every neighborhood query will return the full data set. Even when no spatial index is available, this comes at additional cost in managing the heap. Therefore,
  should be chosen appropriately for the data set.
Extensions
OPTICS-OF is an outlier detection
algorithm based on OPTICS. The main use obviously is the extraction of outliers from an existing run of OPTICS at low cost compared to using a different outlier detection method.
DeLi-Clu, Density-Link-Clustering combines ideas from single-linkage clustering and OPTICS, eliminating the parameter and offering performance improvements over OPTICS.
HiSC is a hierarchical subspace clustering (axis-parallel) method based on optics.
HiCO is a hierarchical correlation clustering
algorithm based on OPTICS.
DiSH is an improvement over HiSC that can find more complex hierarchies.
Availability
Example implementations of OPTICS, OPTICS-OF, DeLi-Clu, HiSC, HiCO and DiSH are available in the ELKI framework
.
Hans-Peter Kriegel
Hans-Peter Kriegel is a German computer scientist and professor at the Ludwig Maximilian University of Munich and leading the Database Systems Group in the Department of Computer Science....
and Jörg Sander.
Its basic idea is similar to DBSCAN
DBSCAN
DBSCAN is a data clustering algorithm proposed by Martin Ester, Hans-Peter Kriegel, Jörg Sander and Xiaowei Xu in 1996....
, but it addresses one of DBSCAN's major weaknesses: the problem of detecting meaningful clusters in data of varying density. In order to do so, the points of the database are (linearly) ordered such that points which are spatially closest become neighbors in the ordering. Additionally, a special distance is stored for each point that represents the density that needs to be accepted for a cluster in order to have both points belong to the same cluster. This is represented as a dendrogram
Dendrogram
A dendrogram is a tree diagram frequently used to illustrate the arrangement of the clusters produced by hierarchical clustering...
.
Basic idea
Like DBSCANDBSCAN
DBSCAN is a data clustering algorithm proposed by Martin Ester, Hans-Peter Kriegel, Jörg Sander and Xiaowei Xu in 1996....
, OPTICS requires two parameters:
, which describes the maximum distance (radius) to consider, and , describing the number of points required to form a cluster. A point is a core point if at least points are found within its -neighborhood . Contrary to DBSCANDBSCAN
DBSCAN is a data clustering algorithm proposed by Martin Ester, Hans-Peter Kriegel, Jörg Sander and Xiaowei Xu in 1996....
, OPTICS also considers points that are part of a more densely packed cluster, so each point is assigned a core distance that basically describes the distance to its
th point:The reachability-distance of a point
from another point is the distance between and , or the core distance of :Basically, if
and are nearest neighbors, this is the we need to assume in order to have and belong to the same cluster.Both the core-distance and the reachability-distance are undefined if no sufficiently dense cluster (w.r.t.
) is available. Given a sufficiently large , this will never happen, but then every -neighborhood query will return the entire database, resulting in runtime. Hence, the parameter is required to cut off the density of clusters that is no longer considered to be interesting and to speed up the algorithm this way.The parameter
is strictly speaking not necessary. It can be set to a maximum value. When a spatial index is available, it does however play a practical role when it comes to complexity. It is often claimed that OPTICS abstracts from DBSCAN by removing this parameter, at least to the amount of only having to give a maximum value.Pseudocode
The basic approach of OPTICS is similar to DBSCANDBSCAN
DBSCAN is a data clustering algorithm proposed by Martin Ester, Hans-Peter Kriegel, Jörg Sander and Xiaowei Xu in 1996....
, but instead of maintaining a set of known, but so far unprocessed cluster members, a priority queue
Priority queue
A priority queue is an abstract data type in computer programming.It is exactly like a regular queue or stack data structure, but additionally, each element is associated with a "priority"....
(e.g. using an indexed heap
Heap (data structure)
In computer science, a heap is a specialized tree-based data structure that satisfies the heap property: if B is a child node of A, then key ≥ key. This implies that an element with the greatest key is always in the root node, and so such a heap is sometimes called a max-heap...
) is used.
OPTICS(DB, eps, MinPts)
for each point p of DB
p.reachability-distance = UNDEFINED
for each unprocessed point p of DB
N = getNeighbors(p, eps)
mark p as processed
output p to the ordered list
Seeds = empty priority queue
if (core-distance(p, eps, Minpts) != UNDEFINED)
update(N, p, Seeds, eps, Minpts)
for each next q in Seeds
N' = getNeighbors(q, eps)
mark q as processed
output q to the ordered list
if (core-distance(q, eps, Minpts) != UNDEFINED)
update(N', q, Seeds, eps, Minpts)
In update, the priority queue Seeds is updated with the
-neighborhood of and , respectively:update(N, p, Seeds, eps, Minpts)
coredist = core-distance(p, eps, MinPts)
for each o in N
if (o is not processed)
new-reach-dist = max(coredist, dist(p,o))
if (o.reachability-distance UNDEFINED) // o is not in Seeds
o.reachability-distance = new-reach-dist
Seeds.insert(o, new-reach-dist)
else // o in Seeds, check for improvement
if (new-reach-dist < o.reachability-distance)
o.reachability-distance = new-reach-dist
Seeds.move-up(o, new-reach-dist)
OPTICS hence outputs the points in a particular ordering, annotated with their smallest reachability distance (in the original algorithm, the core distance is also exported, but this is not required for further processing).
Extracting the Clusters
Dendrogram
A dendrogram is a tree diagram frequently used to illustrate the arrangement of the clusters produced by hierarchical clustering...
), the hierarchical structure of the clusters can be obtained easily. It is a 2D plot, with the ordering of the points on the x-axis and the reachability distance on the y-axis. Since points belonging to a cluster have a low reachability distance to their nearest neighbor, the clusters show up as valleys in the reachability plot. The deeper the valley, the denser the cluster.
The image on the right illustrates this concept. In its upper half, an artificial example of a database consisting of two-dimensional, spatial points is shown. The lower part shows the reachability plot as computed by OPTICS. The black lines link some clusters to their respective valleys. The horizontal red line is an example on how to obtain a clustering. Each valley it crosses is made a cluster of its own. If the line was moved down, more clusters would emerge, especially for the topmost cluster, which features varying densities.
Note that deriving clusters in such a way yields the same result on core points of running DBSCAN
DBSCAN
DBSCAN is a data clustering algorithm proposed by Martin Ester, Hans-Peter Kriegel, Jörg Sander and Xiaowei Xu in 1996....
on the data with
set to the chosen reachability-distance threshold. The assignment of non-core points to neighboring clusters is non-deterministic in DBSCAN, too.The blue points in this image are considered noise, and no valley is found in their reachability plot. This is subject to the
parameter, which bounds the density of clusters.A more advanced analysis does not use a specific value of
, but instead looks for spikes that separate clusters. This can be used to obtain a hierarchical clusteringHierarchical clustering
In statistics, hierarchical clustering is a method of cluster analysis which seeks to build a hierarchy of clusters. Strategies for hierarchical clustering generally fall into two types:...
that cannot be achieved by a single DBSCAN run.
Complexity
Like DBSCAN
DBSCAN
DBSCAN is a data clustering algorithm proposed by Martin Ester, Hans-Peter Kriegel, Jörg Sander and Xiaowei Xu in 1996....
, OPTICS processes each point once, and performs one
-neighborhood query during this processing. Given a spatial index that grants a neighborhood query in runtime, an overall runtime of is obtained. The authors of the original OPTICS paper report an actual constant slowdown factor of 1.6 compared to DBSCAN. Note that the value of might heavily influence the cost of the algorithm, since a value too large might raise the cost of a neighborhood query to linear complexity.In particular, choosing
(larger than the maximum distance in the data set) is possible, but will obviously lead to quadratic complexity, since every neighborhood query will return the full data set. Even when no spatial index is available, this comes at additional cost in managing the heap. Therefore, should be chosen appropriately for the data set.Extensions
OPTICS-OF is an outlier detection
Anomaly detection
Anomaly detection, also referred to as outlier detection refers to detecting patterns in a given data set that do not conform to an established normal behavior....
algorithm based on OPTICS. The main use obviously is the extraction of outliers from an existing run of OPTICS at low cost compared to using a different outlier detection method.
DeLi-Clu, Density-Link-Clustering combines ideas from single-linkage clustering and OPTICS, eliminating the
parameter and offering performance improvements over OPTICS.HiSC is a hierarchical subspace clustering (axis-parallel) method based on optics.
HiCO is a hierarchical correlation clustering
Correlation clustering
In machine learning, correlation clustering or cluster editing operates in a scenario where the relationship between the objects are known instead of the actual representation of the objects...
algorithm based on OPTICS.
DiSH is an improvement over HiSC that can find more complex hierarchies.
Availability
Example implementations of OPTICS, OPTICS-OF, DeLi-Clu, HiSC, HiCO and DiSH are available in the ELKI framework
Environment for DeveLoping KDD-Applications Supported by Index-Structures
ELKI is a knowledge discovery in databases software framework developed for use in research and teaching by the database systems research unit of Professor Hans-Peter Kriegel at the Ludwig Maximilian University of Munich, Germany...
.