

OLAP cube
Encyclopedia
Data structure
In computer science, a data structure is a particular way of storing and organizing data in a computer so that it can be used efficiently.Different kinds of data structures are suited to different kinds of applications, and some are highly specialized to specific tasks...
that allows fast analysis of data. It can also be defined as the capability of manipulating and analyzing data from multiple perspectives. The arrangement of data into cubes overcomes some limitations of relational database
Relational database
A relational database is a database that conforms to relational model theory. The software used in a relational database is called a relational database management system . Colloquial use of the term "relational database" may refer to the RDBMS software, or the relational database itself...
s.
Background
OLAP cubes can be thought of as extensions to the two-dimensional array of a spreadsheetSpreadsheet
A spreadsheet is a computer application that simulates a paper accounting worksheet. It displays multiple cells usually in a two-dimensional matrix or grid consisting of rows and columns. Each cell contains alphanumeric text, numeric values or formulas...
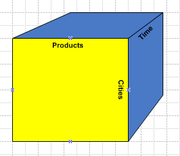
. For example a company might wish to analyze some financial data by product, by time-period, by city, by type of revenue and cost, and by comparing actual data with a budget. These additional methods of analyzing the data are known as dimensions. Because there can be more than three dimensions in an OLAP system the term hypercube
Hypercube
In geometry, a hypercube is an n-dimensional analogue of a square and a cube . It is a closed, compact, convex figure whose 1-skeleton consists of groups of opposite parallel line segments aligned in each of the space's dimensions, perpendicular to each other and of the same length.An...
is sometimes used.
Functionality
The OLAP cube consists of numeric facts called measures which are categorized by dimensionsDimension (data warehouse)
In a data warehouse, a dimension is a data element that categorizes each item in a data set into non-overlapping regions. A data warehouse dimension provides the means to "slice and dice" data in a data warehouse. Dimensions provide structured labeling information to otherwise unordered numeric...
. The cube metadata (structure) may be created from a star schema
Star schema
In computing, the star schema is the simplest style of data warehouse schema. The star schema consists of one or more fact tables referencing any number of dimension tables...
or snowflake schema
Snowflake schema
In computing, a snowflake schema is a logical arrangement of tables in a multidimensional database such that the entity relationship diagram resembles a snowflake in shape. The snowflake schema is represented by centralized fact tables which are connected to multiple dimensions.The snowflake schema...
of tables in a relational database
Relational database
A relational database is a database that conforms to relational model theory. The software used in a relational database is called a relational database management system . Colloquial use of the term "relational database" may refer to the RDBMS software, or the relational database itself...
. Measures are derived from the records in the fact table
Fact table
In data warehousing, a fact table consists of the measurements, metrics or facts of a business process. It is often located at the centre of a star schema or a snowflake schema, surrounded by dimension tables....
and dimensions are derived from the dimension table
Dimension table
In data warehousing, a dimension table is one of the set of companion tables to a fact table.The fact table contains business facts or measures and foreign keys which refer to candidate keys in the dimension tables....
s.
Pivot
A financial analyst might want to view or "pivotPivot table
In data processing, a pivot table is a data summarization tool found in data visualization programs such as spreadsheets or business intelligence software. Among other functions, pivot-table tools can automatically sort, count, total or give the average of the data stored in one table or spreadsheet...
" the data in various ways, such as displaying all the cities down the page and all the products across a page. This could be for a specified period, version and type of expenditure. Having seen the data in this particular way the analyst might then immediately wish to view it in another way. The cube could effectively be re-oriented so that the data displayed now has periods across the page and type of cost down the page. Because this re-orientation involves re-summarizing very large amounts of data, this new view of the data has to be generated efficiently to avoid wasting the analyst's time, i.e. within seconds, rather than the hours a relational database and conventional report-writer might have taken.
Hierarchy
Each of the elements of a dimension could be summarized using a hierarchyHierarchy
A hierarchy is an arrangement of items in which the items are represented as being "above," "below," or "at the same level as" one another...
. The hierarchy is a series of parent-child relationships, typically where a parent member represents the consolidation of the members which are its children. Parent members can be further aggregated as the children of another parent.
For example May 2005 could be summarized into Second Quarter 2005 which in turn would be summarized in the Year 2005. Similarly the cities could be summarized into regions, countries and then global regions; products could be summarized into larger categories; and cost headings could be grouped into types of expenditure. Conversely the analyst could start at a highly summarized level, such as the total difference between the actual results and the budget, and drill down
Drill down
In information technology, to drill down means to move from summary information to detailed data by focusing in on something. In a GUI-environment, "drilling-down" may involve clicking on some representation in order to reveal more detail....
into the cube to discover which locations, products and periods had produced this difference.
OLAP operations
The analyst can understand the meaning contained in the databases using multi-dimensional analysis. By aligning the data content with the analyst's mental model, the chances of confusion and erroneous interpretations are reduced. The analyst can navigate through the database and screen for a particular subset of the data, changing the data's orientations and defining analytical calculations. The user-initiated process of navigating by calling for page displays interactively, through the specification of slices via rotations and drill down/up is sometimes called "slice and dice". Common operations include slice and dice, drill down, roll up, and pivot.Slice: A slice is a subset of a multi-dimensional array corresponding to a single value for one or more members of the dimensions not in the subset.
The picture shows a slicing operation: The sales figures of all sales regions and all product categories of the company in the year 2004 are "sliced" out the data cube.
Dice: The dice operation is a slice on more than two dimensions of a data cube (or more than two consecutive slices).
The picture shows a dicing operation: The new cube shows the sales figures of a limited number of product categories, the time and region dimensions cover the same range as before.
Drill Down/Up: Drilling down or up is a specific analytical technique whereby the user navigates among levels of data ranging from the most summarized (up) to the most detailed (down).
The picture shows a drilling operation: Theres a better understanding of the sales figures of the product category "Outdoor-Schutzausrüstung" since you now see the sales figures for the single products of this category.
Roll-up: A roll-up involves computing all of the data relationships for one or more dimensions. To do this, a computational relationship or formula might be defined.
Pivot: This operation is also called rotate operation. It rotates the data in order to provide an alternative presentation of data - the report or page display takes a different dimensional orientation.
The picture shows a pivoting operation: The whole cube is rotated, giving another perspective on the data.
Linking cubes and sparsity
The commercial OLAP products have different methods of creating and of linking cubes and hypercubes (see Types of OLAP).Linking cubes is a method of overcoming sparsity. Sparsity arises when not every cell in the cube is filled with data and so valuable processing time is taken by effectively adding up zeros. For example revenues may be available for each customer and product but cost data may not be available with this amount of analysis. Instead of creating a sparse cube, it is sometimes better to create another separate, but linked, cube in which a sub-set of the data can be analyzed into great detail. The linking ensures that the data in the cubes remain consistent.
Variance in products
The data in cubes may be updated at times, perhaps by different people. Techniques are therefore often needed to lock parts of the cube while one of the users is writing to it and to recalculate the cube's totals. Other facilities may allow an alert that shows previously calculated totals are no longer valid after the new data have been added, but some products only calculate the totals when they are needed.Technical definition
In database theoryDatabase theory
Database theory encapsulates a broad range of topics related to the study and research of the theoretical realm of databases and database management systems....
, an OLAP cube is an abstract representation of a projection of an RDBMS relation. Given a relation
Relation (database)
In relational model:A relation value, which is assigned to a certain relation variable, is time-varying. By using a Data Definition Language , it is able to define relation variables.The following is an example of a heading which consists of three attributes....
of order N, consider a projection that subtends X, Y, and Z as the key and W as the residual
Residual
A residual is generally a quantity left over at the end of a process. It may refer to:* Residual , in business, one of an ongoing stream of payments for the completion of past achievements...
attribute
Attribute (computing)
In computing, an attribute is a specification that defines a property of an object, element, or file. It may also refer to or set the specific value for a given instance of such....
. Characterizing this as a function
Function (mathematics)
In mathematics, a function associates one quantity, the argument of the function, also known as the input, with another quantity, the value of the function, also known as the output. A function assigns exactly one output to each input. The argument and the value may be real numbers, but they can...
,
- f : (X,Y,Z) → W,
the attributes X, Y, and Z correspond to the axes of the cube, while the W value into which each ( X, Y, Z ) triple maps corresponds to the data element that populates each cell of the cube.
Insofar as two-dimensional output devices cannot readily characterize four dimensions, it is more practical to project "slices" of the data cube (we say project in the classic vector analytic sense of dimensional reduction, not in the SQL
SQL
SQL is a programming language designed for managing data in relational database management systems ....
sense, although the two are conceptually similar), perhaps
- g : (X,Y) → W
which may suppress a primary key, but still have some semantic significance, perhaps a slice of the triadic functional representation for a given Z value of interest.
The motivation behind OLAP
OLAP
In computing, online analytical processing, or OLAP , is an approach to swiftly answer multi-dimensional analytical queries. OLAP is part of the broader category of business intelligence, which also encompasses relational reporting and data mining...
displays harks back to the cross-tabbed report paradigm of 1980s DBMS. One may wish for a spreadsheet
Spreadsheet
A spreadsheet is a computer application that simulates a paper accounting worksheet. It displays multiple cells usually in a two-dimensional matrix or grid consisting of rows and columns. Each cell contains alphanumeric text, numeric values or formulas...
-style display, where values of X populate row $1; values of Y populate column $A; and values of g : ( X, Y ) → W populate the individual cells "southeast of" $B2, so to speak, $B2 itself included. While one can certainly use the DML (Data Manipulation Language
Data Manipulation Language
A data manipulation language is a family of syntax elements similar to a computer programming language used for inserting, deleting and updating data in a database...
) of traditional SQL
SQL
SQL is a programming language designed for managing data in relational database management systems ....
to display ( X, Y, W ) triples, this output format is not nearly as convenient as the cross-tabbed alternative: certainly, the former requires one to hunt linearly for a given ( X, Y ) pair in order to determine the corresponding W value, while the latter enables one to more conveniently scan for the intersection of the proper X column with the proper Y row.
See also
- Comparison of OLAP ServersComparison of OLAP ServersThe following tables compare general and technical information for a number of Online analytical processing servers. Please see the individual products articles for further information.-General information:-Data storage modes:-APIs and query languages:...
- Business intelligenceBusiness intelligenceBusiness intelligence mainly refers to computer-based techniques used in identifying, extracting, and analyzing business data, such as sales revenue by products and/or departments, or by associated costs and incomes....
- Data miningData miningData mining , a relatively young and interdisciplinary field of computer science is the process of discovering new patterns from large data sets involving methods at the intersection of artificial intelligence, machine learning, statistics and database systems...
- Data Mining ExtensionsData Mining ExtensionsData Mining Extensions is a query language for Data Mining Models supported by Microsoft's SQL Server Analysis Services product.Like SQL, it supports a data definition language, data manipulation language and a data query language, all three with SQL-like syntax.Whereas SQL statements operate on...
- Data warehouseData warehouseIn computing, a data warehouse is a database used for reporting and analysis. The data stored in the warehouse is uploaded from the operational systems. The data may pass through an operational data store for additional operations before it is used in the DW for reporting.A data warehouse...
- Data martData martA data mart is the access layer of the data warehouse environment that is used to get data out to the users. The data mart is a subset of the data warehouse which is usually oriented to a specific business line or team.- Terminology :...
- Fast Analysis of Shared Multidimensional Information
- Pivot TablePivot tableIn data processing, a pivot table is a data summarization tool found in data visualization programs such as spreadsheets or business intelligence software. Among other functions, pivot-table tools can automatically sort, count, total or give the average of the data stored in one table or spreadsheet...
- Multidimensional Expressions (MDX)Multidimensional ExpressionsMultidimensional Expressions is a query language for OLAP databases, much like SQL is a query language for relational databases. It is also a calculation language, with syntax similar to spreadsheet formulas.-Background:...
- Online analytical processing (OLAP)OLAPIn computing, online analytical processing, or OLAP , is an approach to swiftly answer multi-dimensional analytical queries. OLAP is part of the broader category of business intelligence, which also encompasses relational reporting and data mining...
- XML for AnalysisXML for AnalysisXML for Analysis is an industry standard for data access in analytical systems, such as OLAP and data mining. XMLA is based on other industry standards such as XML, SOAP and HTTP...