

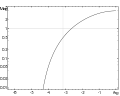
Nichols plot
Encyclopedia
Plot (graphics)
A plot is a graphical technique for representing a data set, usually as a graph showing the relationship between two or more variables. The plot can be drawn by hand or by a mechanical or electronic plotter. Graphs are a visual representation of the relationship between variables, very useful for...
used in signal processing
Signal processing
Signal processing is an area of systems engineering, electrical engineering and applied mathematics that deals with operations on or analysis of signals, in either discrete or continuous time...
and control design
Control theory
Control theory is an interdisciplinary branch of engineering and mathematics that deals with the behavior of dynamical systems. The desired output of a system is called the reference...
.
Use in Control DesignControl theoryControl theory is an interdisciplinary branch of engineering and mathematics that deals with the behavior of dynamical systems. The desired output of a system is called the reference...
Given a transfer functionTransfer function
A transfer function is a mathematical representation, in terms of spatial or temporal frequency, of the relation between the input and output of a linear time-invariant system. With optical imaging devices, for example, it is the Fourier transform of the point spread function i.e...
,

with the closed-loop transfer function
Closed-loop transfer function
A closed-loop transfer function in control theory is a mathematical expression describing the net result of the effects of a closed loop on the input signal to the circuits enclosed by the loop.- Overview :...
defined as,

the Nichols plots displays
 versus
  . Loci of constant
  and
and  are overlaid to allow the designer to obtain the closed loop transfer function directly from the open loop transfer function. Thus, the frequency
  is the parameter along the curve. This plot may be compared to the Bode plot
Bode plot
A Bode plot is a graph of the transfer function of a linear, time-invariant system versus frequency, plotted with a log-frequency axis, to show the system's frequency response...
in which the two inter-related graphs -
 versus
  and
and  versus
  ) - are plotted. Note that the decibel
Decibel
The decibel is a logarithmic unit that indicates the ratio of a physical quantity relative to a specified or implied reference level. A ratio in decibels is ten times the logarithm to base 10 of the ratio of two power quantities...
convention shown above,
 is not unique; another convention sometimes used is
  .
.In feedback control design
Control system
A control system is a device, or set of devices to manage, command, direct or regulate the behavior of other devices or system.There are two common classes of control systems, with many variations and combinations: logic or sequential controls, and feedback or linear controls...
, the plot is useful for assessing the stability and robustness of a linear system. This application of the Nichols plot is central to the Quantitative feedback theory
Quantitative feedback theory
Quantitative feedback theory , developed by Isaac Horowitz , is a frequency domain technique utilising the Nichols chart in order to achieve a desired robust design over a specified region of plant uncertainty...
(QFT) of Horowitz and Sidi, which is a well known method for robust control system design.