

LogMAR chart
Encyclopedia
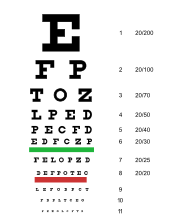
LogMAR charts are used to assess an individual's visual acuity
(VA). LogMAR means the logarithm
of the Minimum Angle of Resolution. It is recommended that whenever research
on visual acuity has to be done, the LogMAR chart is to be used. This has led to the assertion that researches done using a logarithmic progression in size of letters on test chart gives most accurate VA measurement.The reason for this is unlike other visual acuity charts such as the Snellen chart etc, the LogMAR chart has equal graduation
between the letters on a line as well as the space between lines. Again, there is a fixed number of letter - five letters on each line.
 Contrary to the LogMAR chart, the Snellen chart which is also used in assessing visual acuities has the following differences:
Each letter has a score value of 0.02 log units. Since there are 5 letters per line, the total score for a line on the LogMAR chart represents a change of 0.1 log units. The formula used in calculating the score is:
Visual acuity
Visual acuity is acuteness or clearness of vision, which is dependent on the sharpness of the retinal focus within the eye and the sensitivity of the interpretative faculty of the brain....
(VA). LogMAR means the logarithm
Logarithm
The logarithm of a number is the exponent by which another fixed value, the base, has to be raised to produce that number. For example, the logarithm of 1000 to base 10 is 3, because 1000 is 10 to the power 3: More generally, if x = by, then y is the logarithm of x to base b, and is written...
of the Minimum Angle of Resolution. It is recommended that whenever research
Research
Research can be defined as the scientific search for knowledge, or as any systematic investigation, to establish novel facts, solve new or existing problems, prove new ideas, or develop new theories, usually using a scientific method...
on visual acuity has to be done, the LogMAR chart is to be used. This has led to the assertion that researches done using a logarithmic progression in size of letters on test chart gives most accurate VA measurement.The reason for this is unlike other visual acuity charts such as the Snellen chart etc, the LogMAR chart has equal graduation
Graduation
Graduation is the action of receiving or conferring an academic degree or the ceremony that is sometimes associated, where students become Graduates. Before the graduation, candidates are referred to as Graduands. The date of graduation is often called degree day. The graduation itself is also...
between the letters on a line as well as the space between lines. Again, there is a fixed number of letter - five letters on each line.
History
The chart was designed by Bailey and Lovie in 1980. They said the following concerning the chart, "We have designed a series of near vision charts in which the typeface, size progression, size range, number of words per row and spacings were chosen in an endeavour to achieve a standardization of the test task.Relation to the Snellen chart
- Different number of letters on a line
- Unequal graduations from one line to the other
Recording Visual Acuity using the LogMAR chart
| Foot | Metre | Decimal | LogMAR |
|---|---|---|---|
| 20/200 | 6/60 | 0.10 | 1.00 |
| 20/160 | 6/48 | 0.125 | 0.90 |
| 20/125 | 6/38 | 0.16 | 0.80 |
| 20/100 | 6/30 | 0.20 | 0.70 |
| 20/80 | 6/24 | 0.25 | 0.60 |
| 20/63 | 6/19 | 0.32 | 0.50 |
| 20/50 | 6/15 | 0.40 | 0.40 |
| 20/40 | 6/12 | 0.50 | 0.30 |
| 20/32 | 6/9.5 | 0.63 | 0.20 |
| 20/25 | 6/7.5 | 0.80 | 0.10 |
| 20/20 | 6/6 | 1.00 | 0.00 |
| 20/16 | 6/4.8 | 1.25 | -0.10 |
| 20/12.5 | 6/3.8 | 1.60 | -0.20 |
| 20/10 | 6/3 | 2.00 | -0.30 |
Each letter has a score value of 0.02 log units. Since there are 5 letters per line, the total score for a line on the LogMAR chart represents a change of 0.1 log units. The formula used in calculating the score is:
- LogMAR VA = 0.1 + LogMAR value of the best line read - 0.02 X (number of letters read)
Advantages of LogMAR over other charts
- Equal number of letter per line
- Regular spacing between lines and letters
- Uniform progression in letter size
- Final score based precisely on total of all letters read
- Finer grading scale allows greater accuracy and improved test/retest reliability