

List of micropolitan areas in New Mexico
Encyclopedia
U.S. state
A U.S. state is any one of the 50 federated states of the United States of America that share sovereignty with the federal government. Because of this shared sovereignty, an American is a citizen both of the federal entity and of his or her state of domicile. Four states use the official title of...
of New Mexico
New Mexico
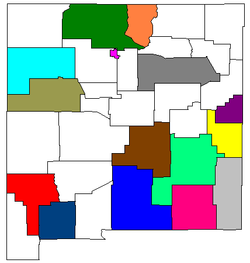
New Mexico is a state located in the southwest and western regions of the United States. New Mexico is also usually considered one of the Mountain States. With a population density of 16 per square mile, New Mexico is the sixth-most sparsely inhabited U.S...
has a total of fifteen micropolitan areas. As of the 2000 Census
United States Census, 2000
The Twenty-second United States Census, known as Census 2000 and conducted by the Census Bureau, determined the resident population of the United States on April 1, 2000, to be 281,421,906, an increase of 13.2% over the 248,709,873 persons enumerated during the 1990 Census...
, these counties had a combined population of 589,371 (32.4% of the state's total population). Based on a July 1, 2009 population estimate, that figure had increased to 597,079 (29.7% of the state's total population).
Micropolitan areas
|
|
1 - part of the Clovis-Portales combined statistical area
Clovis-Portales combined statistical area
The Clovis-Portales Combined Statistical Area is made up of two counties in east central New Mexico. The statistical area consists of the Clovis Micropolitan Statistical Area and the Portales Micropolitan Statistical Area...
2 - part of the Santa Fe-Espanola combined statistical area
Santa Fe-Espanola combined statistical area
The Santa Fe-Española Combined Statistical Area is made up of two counties in north central New Mexico. The statistical area consists of the Santa Fe Metropolitan Statistical Area and the Española Micropolitan Statistical Area...
Population statistics
| Micropolitan Statistical Area | July 1, 2009 Estimate |
2000 Population |
Percent Change (2000–2009) |
|---|---|---|---|
| Alamogordo Otero County, New Mexico -2010:Whereas according to the 2010 U.S. Census Bureau:*72.7% White*3.5% Black*6.7% Native American*1.2% Asian*0.2% Native Hawaiian or Pacific Islander*4.2% Two or more races*11.2% Other races*34.5% Hispanic or Latino -2000:... |
63,201 | 62,298 | 1.45% |
| Carlsbad-Artesia Eddy County, New Mexico -2010:Whereas according to the 2010 U.S. Census Bureau:*77.4% White*1.4% Black*1.5% Native American*0.7% Asian*0.0% Native Hawaiian or Pacific Islander*3.0% Two or more races*16.0% Other races*44.1% Hispanic or Latino -2000:... |
52,706 | 51,658 | –2.03% |
| Clovis Curry County, New Mexico Curry County is a county located in the U.S. state of New Mexico. The population was approximately 45,044 at the 2000 census. Its county seat is Clovis. It is named in honor of George Curry, territorial governor of New Mexico from 1907 to 1910... |
44,407 | 45,044 | –1.41% |
| Deming Luna County, New Mexico -2010:Whereas according to the 2010 U.S. Census Bureau:*77.7% White*1.1% Black*1.3% Native American*0.5% Asian*0.0% Native Hawaiian or Pacific Islander*2.6% Two or more races*16.8% Other races*61.5% Hispanic or Latino -2000:... |
27,044 | 25,016 | 8.11% |
| Espanola Rio Arriba County, New Mexico -2010:Whereas according to the 2010 U.S. Census Bureau:*51.6% White*0.5% Black*16.0% Native American*0.4% Asian*0.0% Native Hawaiian or Pacific Islander*3.3% Two or more races*28.2% Other races*71.3% Hispanic or Latino -2000:... |
40,678 | 41,190 | –1.24% |
| Gallup McKinley County, New Mexico -2010:Whereas according to the 2010 U.S. Census Bureau:*15.2% White*0.5% Black*75.5% Native American*0.8% Asian*0.0% Native Hawaiian or Pacific Islander*3.1% Two or more races*4.6% Other races*13.3% Hispanic or Latino -2000:... |
70,513 | 74,798 | –5.73% |
| Grants Cibola County, New Mexico -2010:Whereas according to the 2010 U.S. Census Bureau:*41.8% White*1.0% Black*41.0% Native American*0.5% Asian*0.1% Native Hawaiian or Pacific Islander*3.1% Two or more races*12.5% Other races*36.5% Hispanic or Latino -2000:... |
27,036 | 25,595 | 5.63% |
| Hobbs Lea County, New Mexico -2010:Whereas according to the 2010 U.S. Census Bureau:*75.0% White*4.1% Black*1.2% Native American*0.5% Asian*0.1% Native Hawaiian or Pacific Islander*2.6% Two or more races*16.5% Other races*51.1% Hispanic or Latino -2000:... |
60,232 | 55,511 | 8.50% |
| Las Vegas San Miguel County, New Mexico -2010:Whereas according to the 2010 U.S. Census Bureau:*66.6% White*1.4% Black*1.7% Native American*0.8% Asian*0.1% Native Hawaiian or Pacific Islander*3.9% Two or more races*25.5% Other races*76.8% Hispanic or Latino -2000:... |
28,323 | 30,126 | –5.98% |
| Los Alamos Los Alamos County, New Mexico -2010:Whereas according to the 2010 U.S. Census Bureau:*87.8% White*0.6% Black*0.8% Native American*6.0% Asian*0.0% Native Hawaiian or Pacific Islander*2.6% Two or more races*2.2% Other races*14.7% Hispanic or Latino -2000:... |
18,074 | 18,343 | –1.47% |
| Portales Roosevelt County, New Mexico -2010:Whereas according to the 2010 U.S. Census Bureau:*76.9% White*1.8% Black*1.3% Native American*0.9% Asian*0.0% Native Hawaiian or Pacific Islander*3.2% Two or more races*15.9% Other races*39.9% Hispanic or Latino -2000:... |
18,817 | 18,018 | 4.43% |
| Roswell Chaves County, New Mexico -2010:Whereas according to the 2010 U.S. Census Bureau:*70.9% White*2.0% Black*1.2% Native American*0.6% Asian*0.1% Native Hawaiian or Pacific Islander*3.2% Two or more races*22.0% Other races*52.0% Hispanic or Latino -2000:... |
63,322 | 61,382 | 3.65% |
| Ruidoso Lincoln County, New Mexico -2010:Whereas according to the 2010 U.S. Census Bureau:*85.1% White*0.5% Black*2.4% Native American*0.4% Asian*0.0% Native Hawaiian or Pacific Islander*2.5% Two or more races*9.1% Other races*29.8% Hispanic or Latino -2000:... |
21,016 | 19,411 | 8.27% |
| Silver City Grant County, New Mexico -2010:Whereas according to the 2010 U.S. Census Bureau:*84.9% White*0.9% Black*1.4% Native American*0.4% Asian*0.1% Native Hawaiian or Pacific Islander*2.8% Two or more races*9.8% Other races*48.3% Hispanic or Latino -2000:... |
29,903 | 31,002 | –3.54% |
| Taos Taos County, New Mexico -2010:Whereas according to the 2010 U.S. Census Bureau:*68.7% White*0.4% Black*6.2% Native American*0.7% Asian*0.0% Native Hawaiian or Pacific Islander*3.9% Two or more races*20.1% Other races*55.8% Hispanic or Latino -2000:... |
31,507 | 29,979 | 5.10% |
See also
- List of metropolitan areas in New Mexico
- List of cities in New Mexico
- New Mexico census statistical areasNew Mexico census statistical areasThe United States Census Bureau has defined 2 Combined Statistical Areas , 4 Metropolitan Statistical Areas , and 15 Micropolitan Statistical Areas in the State of New Mexico. The following table describes these areas with the following information:*The name of the Combined Statistical Area , if...
- Table of United States primary census statistical areas (PCSA)
- Table of United States Combined Statistical AreasTable of United States Combined Statistical Areasthumb|An enlargeable map of the 125 [[Combined Statistical Area]]s of the [[United States]]The United States Office of Management and Budget has defined 125 Combined Statistical Areas for the United States of America...
(CSA) - Table of United States Metropolitan Statistical AreasTable of United States Metropolitan Statistical Areasthumb|An enlargeable map of the 942 [[Core Based Statistical Area]]s of the [[United States]]. The 367 [[Metropolitan Statistical Area]]s are shown in red....
(MSA) - Table of United States Micropolitan Statistical AreasTable of United States Micropolitan Statistical Areasthumb|An enlargeable map of the 942 [[Core Based Statistical Area]]s of the [[United States]]. The 576 [[Micropolitan Statistical Area]]s are shown in blue....
(μSA)