

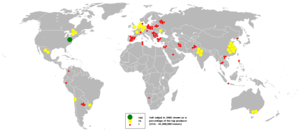
List of countries by salt production
Encyclopedia
Salt
In chemistry, salts are ionic compounds that result from the neutralization reaction of an acid and a base. They are composed of cations and anions so that the product is electrically neutral...
in 2006 mostly based on British Geological Survey accessed in September 2008.
| Rank | Country/Region | Salt production (tonnes) | % of world production |
|---|---|---|---|
| — | World | 210,000,000 | 100 % |
| 1 |  United States United States |
46,500,000 | % |
| 2 |  People's Republic of China People's Republic of China |
37,101,000 | % |
| 3 |  India India |
15,000,000 | % |
| 4 |  Canada Canada |
14,125,000 | % |
| 5 |  Australia Australia |
11,211,000 | % |
| 6 |  Mexico Mexico |
8,180,000 | % |
| 7 |  Early Modern France Early Modern France |
7,000,000 | % |
| 8 |  Brazil Brazil |
6,500,000 | % |
| 9 |  Chile Chile |
6,000,000 | % |
| 10 |  United Kingdom United Kingdom |
5,800,000 | % |
| 11 |  Netherlands Netherlands |
5,000,000 | % |
| 12 |  Italy Italy |
3,600,000 | % |
| 13 |  Spain Spain |
3,200,000 | % |
| 14 |  Russia Russia |
2,800,000 | % |
| 15 |  Iran Iran |
2,618,000 | % |
| 16 |  Kingdom of Romania Kingdom of Romania |
2,450,000 | % |
| 17 |  Egypt Egypt |
2,400,000 | % |
| 18 |  Ukraine Ukraine |
2,300,000 | % |
| 19 |  Turkey Turkey |
2,250,000 | % |
| 20 |  Kingdom of Bulgaria Kingdom of Bulgaria |
1,800,000 | % |
| 21 |  Poland Poland |
1,600,000 | % |
| 22 |  Pakistan Pakistan |
1,320,000 | % |
| 23 |  Vietnam Vietnam |
1,300,000 | % |
| 24 |  Japan Japan |
1,251,000 | % |
| 25 |  Argentina Argentina |
1,200,000 | % |
| 26 |  Thailand Thailand |
1,000,000 | % |
| 27 |  The Bahamas The Bahamas |
900,000 | % |
| 28 |  Palestinian territories Palestinian territories |
800,000 | % |
| 29 |  South Korea South Korea |
800,000 | % |
| 31 |  Germany Germany |
746,000 | % |
| 30 |  Namibia Namibia |
700,000 | % |
| 32 |  Indonesia Indonesia |
680,000 | % |
| 33 |  Denmark Denmark |
610,000 | % |
| 34 |  Tunisia Tunisia |
608,000 | % |
| 35 |  Philippines Philippines |
600,000 | % |
| 36 |  Portugal Portugal |
600,000 | % |
| 37 |  Colombia Colombia |
540,000 | % |
| 38 |  Netherlands Antilles Netherlands Antilles |
500,000 | % |
| 39 |  North Korea North Korea |
500,000 | % |
| 40 |  Jordan Jordan |
410,000 | % |
| 41 |  Austria Austria |
401,000 | % |
| 42 |  Bangladesh Bangladesh |
350,000 | % |
| 43 |  Venezuela Venezuela |
350,000 | % |
| 44 |  South Africa South Africa |
336,000 | % |
| 45 |  Belarus Belarus |
300,000 | % |
| 46 |  Switzerland Switzerland |
300,000 | % |
| 47 |  Ghana Ghana |
250,000 | % |
| 48 |  Peru Peru |
249,000 | % |
| 49 |  Morocco Morocco |
240,000 | % |
| 50 |  Turkmenistan Turkmenistan |
215,000 | % |
| 51 |  Botswana Botswana |
208,000 | % |
| 52 |  Martinique Martinique |
200,000 | % |
| 53 |  Saudi Arabia Saudi Arabia |
200,000 | % |
| 54 |  Cuba Cuba |
185,000 | % |
| 55 |  Algeria Algeria |
183,000 | % |
| 56 |  Greece Greece |
150,000 | % |
| 57 |  Syria Syria |
146,000 | % |
| 58 |  Senegal Senegal |
130,000 | % |
| 59 |  Slovenia Slovenia |
125,000 | % |
| 60 |  Yemen Yemen |
120,000 | % |
| 61 |  Kuwait Kuwait |
100,000 | % |
| 62 |  Slovakia Slovakia |
100,000 | % |