
List of countries by external debt
Encyclopedia
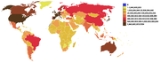
This is a list of countries by external debt
, the total public and private debt owed to nonresidents repayable in internationally accepted currencies, goods, or services, where the public debt is the money
or credit owed by any level of government, from central to local, and the private debt the money or credit owed by private households or private corporations based in the country under consideration.
The total United States public debt
is numerically very similar to United States external debt, but only about a third of United States public debt is external. http://globalpublicsquare.blogs.cnn.com/2011/07/21/who-owns-america-hint-its-not-china/ For discussions of debt ceilings and government defaults in the US and Europe, public debt figures need to be considered.
For informational purposes several non-sovereign entities are also included in this list. Note that this list is gross debt, not net debt. For net debt, see Net international investment position
.
https://www.cia.gov/library/publications/the-world-factbook/rankorder/2079rank.html
External debt
External debt is that part of the total debt in a country that is owed to creditors outside the country. The debtors can be the government, corporations or private households. The debt includes money owed to private commercial banks, other governments, or international financial institutions such...
, the total public and private debt owed to nonresidents repayable in internationally accepted currencies, goods, or services, where the public debt is the money
Money
Money is any object or record that is generally accepted as payment for goods and services and repayment of debts in a given country or socio-economic context. The main functions of money are distinguished as: a medium of exchange; a unit of account; a store of value; and, occasionally in the past,...
or credit owed by any level of government, from central to local, and the private debt the money or credit owed by private households or private corporations based in the country under consideration.
The total United States public debt
United States public debt
The United States public debt is the money borrowed by the federal government of the United States at any one time through the issue of securities by the Treasury and other federal government agencies...
is numerically very similar to United States external debt, but only about a third of United States public debt is external. http://globalpublicsquare.blogs.cnn.com/2011/07/21/who-owns-america-hint-its-not-china/ For discussions of debt ceilings and government defaults in the US and Europe, public debt figures need to be considered.
For informational purposes several non-sovereign entities are also included in this list. Note that this list is gross debt, not net debt. For net debt, see Net international investment position
Net international investment position
The difference between a country's external financial assets and its liabilities is the net international investment position . Both public and private held external assets and liabilities by legal residents of the respective country are hereby taken into account...
.
| Rank | Country | External Debt US dollars | Date | Per capita Per capita Per capita is a Latin prepositional phrase: per and capita . The phrase thus means "by heads" or "for each head", i.e. per individual or per person... US dollars | % of GDP |
|---|---|---|---|---|---|
| 1 |  United States United States |
15,041,163,000,000 | 30 June 2011 | 47,568 | 99 |
| — |  European Union European Union |
13,720,000,000,000 | 30 June 2010 | 27,864 | 85 |
| 2 |  United Kingdom United Kingdom |
8,981,000,000,000 | 30 June 2010 | 144,338 | 400 |
| 3 |  Germany Germany |
4,713,000,000,000 | 30 June 2010 | 57,755 | 142 |
| 4 |  Early Modern France Early Modern France |
4,698,000,000,000 | 30 June 2010 | 74,619 | 182 |
| 5 |  Japan Japan |
2,441,000,000,000 | 30 September 2010 | 19,148 | 45 |
| 6 |  Republic of Ireland Republic of Ireland |
2,378,000,000,000 | 10 November 2011 | 519,070 | 1,165 |
| 7 |  Italy Italy |
2,223,000,000,000 | 30 June 2010 est. | 36,841 | 108 |
| 8 |  Spain Spain |
2,166,000,000,000 | 30 June 2010 | 47,069 | 154 |
| 9 |  LuxembourgAs the Bank of International Settlements explains, small countries with large financial sectors tend to have disproportionately large gross external debts as well as holding large cross-border debt assets.http://www.bis.org/ifc/events/5ifcconf/dias.pdf Luxembourg is a net creditor country. LuxembourgAs the Bank of International Settlements explains, small countries with large financial sectors tend to have disproportionately large gross external debts as well as holding large cross-border debt assets.http://www.bis.org/ifc/events/5ifcconf/dias.pdf Luxembourg is a net creditor country. |
1,892,000,000,000 | 30 June 2010 | 3,696,467 | 3,443 |
| 10 |  Belgium Belgium |
1,241,000,000,000 | 30 June 2010 | 113,603 | 266 |
| 11 |  Switzerland Switzerland |
1,200,000,000,000 | 30 September 2010 | 154,063 | 229 |
| 12 |  Australia Australia |
1,169,000,000,000 | 31 December 2010 est. | 52,596 | 95 |
| 13 |  Canada Canada |
1,009,000,000,000 | 30 June 2010 | 29,625 | 64 |
| 14 |  Sweden Sweden |
853,300,000,000 | 30 June 2010 | 91,487 | 187 |
| 15 |  Austria Austria |
755,000,000,000 | 30 June 2010 | 90,128 | 200 |
| 16 |  Hong Kong Hong Kong |
750,800,000,000 | 31 December 2010 est. | 105,420 | 334 |
| 17 |  Norway Norway |
643,000,000,000 | 12 August 2011 | 131,220 | 141 |
| 18 |  Denmark Denmark |
559,500,000,000 | 30 June 2010 | 101,084 | 180 |
| 19 |  Greece Greece |
532,900,000,000 | 30 June 2010 | 47,636 | 174 |
| 20 |  Portugal Portugal |
497,800,000,000 | 30 June 2010 | 46,795 | 217 |
| 21 |  Russia Russia |
480,200,000,000 | 30 November 2010 est. | 3,421 | 33 |
| 22 |  Netherlands Netherlands |
371,028,000,000 | 31 December 2009 | 47,172 | 74 |
| 23 |  Finland Finland |
370,800,000,000 | 30 June 2010 | 68,960 | 155 |
| 24 |  South Korea South Korea |
370,100,000,000 | 31 December 2010 est. | 7,567 | 37 |
| 25 |  Brazil Brazil |
310,800,000,000 | 31 December 2010 est. | 1,608 | 15 |
| 26 |  Chile Chile |
316,900,000,000 | 30 June 2011 | 280 | 20 |
| 27 |  Turkey Turkey |
270,700,000,000 | 31 December 2010 est. | 3,794 | 36 |
| 28 |  Poland Poland |
252,900,000,000 | 31 December 2010 est. | 6,639 | 54 |
| 29 |  Mexico Mexico |
212,500,000,000 | 31 December 2010 est. | 1,956 | 20 |
| 30 |  Indonesia Indonesia |
196,100,000,000 | 31 December 2010 est. | 837 | 28 |
| 31 |  Argentina Argentina |
160,900,000,000 | 30 September 2010 est. | 3,971 | 43 |
| 32 |  Hungary Hungary |
148,400,000,000 | 31 December 2010 est. | 14,821 | 115 |
| 33 |  United Arab Emirates United Arab Emirates |
122,700,000,000 | 31 December 2010 est. | 24,273 | 41 |
| 34 |  Kingdom of Romania Kingdom of Romania |
108,900,000,000 | 31 December 2010 est. | 5,082 | 67 |
| 35 |  Ukraine Ukraine |
97,500,000,000 | 31 December 2010 est. | 2,144 | 71 |
| 36 |  Kazakhstan Kazakhstan |
94,440,000,000 | 31 December 2010 est. | 6,060 | 68 |
| 37 |  Israel Israel |
89,680,000,000 | 31 December 2010 est. | 12,070 | 42 |
| 38 |  Czech Republic Czech Republic |
86,790,000,000 | 31 December 2010 est. | 8,260 | 45 |
| 39 | Chile |
84,510,000,000 | 31 December 2010 est. | 4,916 | 42 |
| 40 |  Saudi Arabia Saudi Arabia |
82,920,000,000 | 31 December 2010 est. | 3,176 | 19 |
| 41 |  Thailand Thailand |
82,500,000,000 | 31 December 2010 est. | 1,292 | 26 |
| 42 |  South Africa South Africa |
80,520,000,000 | 30 June 2010 est. | 1,613 | 23 |
| 43 |  Malaysia Malaysia |
72,600,000,000 | 31 December 2010 est. | 2,570 | 31 |
| 44 |  Qatar Qatar |
71,380,000,000 | 31 December 2010 est. | 41,988 | 55 |
| 45 |  New Zealand New Zealand |
219,589,000,000 | March 2011 | 50,260 | 127 |
| 46 |  Philippines Philippines |
59,770,000,000 | 30 September 2010 est. | 636 | 32 |
| 47 |  Independent State of Croatia Independent State of Croatia |
59,700,000,000 | 31 December 2010 est. | 13,519 | 99 |
| 48 |  Slovakia Slovakia |
59,330,000,000 | 30 June 2010 est. | 10,926 | 68 |
| 49 |  Colombia Colombia |
57,740,000,000 | 31 December 2010 est. | 1,269 | 20 |
| 50 |  Pakistan Pakistan |
57,210,000,000 | 31 December 2010 est. | 343 | 33 |
| 51 |  Kuwait Kuwait |
56,810,000,000 | 31 December 2010 est. | 15,754 | 43 |
| 52 |  Venezuela Venezuela |
55,610,000,000 | 31 December 2010 est. | 1,906 | 19 |
| 53 |  Iraq Iraq |
52,580,000,000 | 31 December 2010 est. | 1,641 | 64 |
| 54 |  Slovenia Slovenia |
51,570,000,000 | 30 June 2010 | 25,555 | 108 |
| 55 |  Kingdom of Bulgaria Kingdom of Bulgaria |
47,150,000,000 | 30 November 2010 est. | 6,261 | 99 |
| 56 |  Sudan Sudan |
37,980,000,000 | 31 December 2010 est. | 946 | 55 |
| 57 |  Latvia Latvia |
37,280,000,000 | 31 December 2010 est. | 16,584 | 155 |
| 58 |  Lebanon Lebanon |
34,450,000,000 | 31 December 2010 est. | 8,815 | 88 |
| 59 |  Vietnam Vietnam |
33,450,000,000 | 31 December 2010 est. | 379 | 32 |
| 60 |  Peru Peru |
33,290,000,000 | 31 December 2010 est. | 1,126 | 22 |
| 61 |  Cyprus Cyprus |
32,610,000,000 | 31 December 2008 est. | 37,812 | 129 |
| 62 |  Serbia Serbia |
30,900,000,000 | 30 November 2010 est. | 4,178 | 80 |
| 63 |  Egypt Egypt |
30,610,000,000 | 31 December 2010 est. | 391 | 14 |
| 64 |  Lithuania Lithuania |
27,600,000,000 | 31 December 2010 est. | 8,381 | 76 |
| 65 |  Belarus Belarus |
24,800,000,000 | 31 December 2010 est. | 2,629 | 45 |
| 66 |  Bangladesh Bangladesh |
24,460,000,000 | 31 December 2010 est. | 149 | 23 |
| 67 |  Morocco Morocco |
22,690,000,000 | 31 December 2010 est. | 712 | 22 |
| 68 |  Estonia Estonia |
22,210,000,000 | 31 December 2010 est. | 17,284 | 112 |
| 69 |  Singapore Singapore |
21,660,000,000 | 31 December 2010 est. | 4,194 | 10 |
| 70 |  Cuba Cuba |
19,750,000,000 | 31 December 2010 est. | 1,780 | 34 |
| 71 |  Tunisia Tunisia |
18,760,000,000 | 31 December 2010 est. | 1,779 | 42 |
| 72 |  Monaco Monaco |
16,500,000,000 | July 2011 est. | 5,265 | 260 |
| 73 |  Angola Angola |
17,980,000,000 | 31 December 2010 est. | 944 | 21 |
| 74 |  Sri Lanka Sri Lanka |
17,970,000,000 | 31 December 2010 est. | 881 | 36 |
| 75 |  Guatemala Guatemala |
17,470,000,000 | 31 December 2010 est. | 1,216 | 42 |
| 76 |  Ecuador Ecuador |
14,710,000,000 | 31 December 2010 est. | 995 | 25 |
| 77 |  Bahrain Bahrain |
14,680,000,000 | 31 December 2010 est. | 13,261 | 65 |
| 78 |  Panama Panama |
13,850,000,000 | 31 December 2010 est. | 3,927 | 52 |
| 79 |  Democratic Republic of the Congo Democratic Republic of the Congo |
13,500,000,000 | 2009 est. | 197 | 122 |
| 80 |  Uruguay Uruguay |
13,390,000,000 | 31 December 2010 est. | 3,989 | 33 |
| 81 |  Dominican Republic Dominican Republic |
13,090,000,000 | 31 December 2010 est. | 1,326 | 25 |
| 82 |  Iran Iran |
12,840,000,000 | 31 December 2010 est. | 170 | 4 |
| 83 |  Jamaica Jamaica |
12,660,000,000 | 31 December 2010 est. | 4,660 | 92 |
| 84 |  North Korea North Korea |
12,500,000,000 | 2001 est. | 544 | 0 |
| 85 |  Côte d'Ivoire Côte d'Ivoire |
11,600,000,000 | 31 December 2010 est. | 527 | 51 |
| 86 |  El Salvador El Salvador |
11,450,000,000 | 31 December 2010 est. | 1,953 | 53 |
| 87 |  Nigeria Nigeria |
11,020,000,000 | 31 December 2010 est. | 71 | 5 |
| 88 |  Oman Oman |
8,829,000,000 | 31 December 2010 est. | 2,962 | 16 |
| 89 |  Costa Rica Costa Rica |
8,550,000,000 | 31 December 2010 est. | 1,874 | 24 |
| 90 |  Bosnia and Herzegovina Bosnia and Herzegovina |
7,996,000,000 | 31 December 2010 est. | 2,052 | 48 |
| 91 |  Kenya Kenya |
7,935,000,000 | 31 December 2010 est. | 200 | 25 |
| 92 |  Syria Syria |
7,682,000,000 | 31 December 2010 est. | 373 | 13 |
| 93 |  Zimbabwe Zimbabwe |
7,662,000,000 | 31 December 2010 est. | 609 | 103 |
| 94 |  Tanzania Tanzania |
7,576,000,000 | 31 December 2010 est. | 183 | 33 |
| 95 |  Yemen Yemen |
7,147,000,000 | 31 December 2010 est. | 293 | 23 |
| 96 |  Myanmar Myanmar |
7,145,000,000 | 31 December 2010 est. | 117 | 17 |
| 97 |  Ghana Ghana |
6,483,000,000 | 31 December 2010 est. | 274 | 21 |
| 98 |  Libya Libya |
6,378,000,000 | 31 December 2010 est. | 972 | 9 |
| 99 |  Malta Malta |
5,978,000,000 | 31 December 2010 | 14,233 | 72 |
| 100 |  Laos Laos |
5,797,000,000 | 2010 est. | 900 | 91 |
| 101 |  Jordan Jordan |
5,522,000,000 | 31 December 2010 est. | 903 | 20 |
| 102 |  Republic of Macedonia Republic of Macedonia |
5,485,000,000 | 30 September 2010 est. | 2,668 | 60 |
| 103 |  Armenia Armenia |
5,227,000,000 | 30 June 2010 | 1,584 | 56 |
| 104 |  Mauritius Mauritius |
5,043,000,000 | 31 December 2010 est. | 3,937 | 52 |
| 105 |  Turkmenistan Turkmenistan |
5,000,000,000 | 2009 est. | 978 | 25 |
| 106 |  Republic of the Congo Republic of the Congo |
5,000,000,000 | 2000 est. | 1,722 | 155 |
| 107 |  Mozambique Mozambique |
4,990,000,000 | 31 December 2010 est. | 231 | 50 |
| 108 |  Moldova Moldova |
4,618,000,000 | 30 September 2010 est. | 1,296 | 79 |
| 109 |  Nepal Nepal |
4,500,000,000 | 2009 | 161 | 35 |
| 110 |  Cambodia Cambodia |
4,338,000,000 | 31 December 2010 est. | 304 | 37 |
| 111 |  Trinidad and Tobago Trinidad and Tobago |
4,303,000,000 | 31 December 2010 est. | 3,502 | 21 |
| 112 |  Ethiopia Ethiopia |
4,289,000,000 | 31 December 2010 est. | 51 | 14 |
| 113 |  Uzbekistan Uzbekistan |
4,236,000,000 | 31 December 2010 est. | 150 | 11 |
| 114 |  Algeria Algeria |
4,138,000,000 | 31 December 2010 est. | 115 | 3 |
| 115 |  Nicaragua Nicaragua |
4,030,000,000 | 31 December 2010 est. | 693 | 62 |
| 116 |  Senegal Senegal |
3,885,000,000 | 31 December 2010 est. | 296 | 30 |
| 117 |  Kyrgyzstan Kyrgyzstan |
3,738,000,000 | 30 June 2010 | 699 | 81 |
| 118 |  Honduras Honduras |
3,540,000,000 | 31 December 2010 est. | 465 | 23 |
| 119 |  Zambia Zambia |
3,495,000,000 | 31 December 2010 est. | 264 | 22 |
| 120 |  Georgia (country) Georgia (country) |
3,381,000,000 | 31 December 2009 | 771 | 31 |
| 121 |  Cameroon Cameroon |
3,344,000,000 | 31 December 2010 est. | 164 | 15 |
| 122 |  Azerbaijan Azerbaijan |
3,221,000,000 | 31 December 2010 est. | 356 | 6 |
| 123 |  Liberia Liberia |
3,200,000,000 | 2005 est. | 930 | 590 |
| 124 |  Iceland Iceland |
3,073,000,000 | 2002 | 10,670 | 35 |
| 125 |  Guinea Guinea |
3,072,000,000 | 31 December 2009 est. | 305 | 68 |
| 126 |  Somalia Somalia |
3,000,000,000 | 2001 est. | 386 | 0 |
| 127 |  Madagascar Madagascar |
2,973,000,000 | 31 December 2010 est. | 140 | 36 |
| 128 |  Benin Benin |
2,894,000,000 | 31 December 2009 est. | 308 | 43 |
| 129 |  Uganda Uganda |
2,888,000,000 | 31 December 2010 est. | 85 | 17 |
| 130 |  Bolivia Bolivia |
2,864,000,000 | 31 December 2010 est. | 275 | 15 |
| 131 |  Albania Albania |
2,810,000,000 | 2009 | 882 | 23 |
| 132 |  Mali Mali |
2,800,000,000 | 2002 | 254 | 88 |
| 133 |  Afghanistan Afghanistan |
2,700,000,000 | FY08/09 | 92 | 22 |
| 134 |  Paraguay Paraguay |
2,445,000,000 | 31 December 2010 est. | 382 | 13 |
| 135 |  Gabon Gabon |
2,374,000,000 | 31 December 2010 est. | 1,587 | 18 |
| 136 |  Namibia Namibia |
2,373,000,000 | 31 December 2010 est. | 1,131 | 20 |
| 137 |  Botswana Botswana |
2,222,000,000 | 31 December 2010 est. | 1,208 | 16 |
| 138 |  Niger Niger |
2,100,000,000 | 2003 est. | 178 | 79 |
| 139 |  Burkina Faso Burkina Faso |
2,002,000,000 | 31 December 2010 est. | 136 | 23 |
| 140 |  Tajikistan Tajikistan |
1,997,000,000 | 31 December 2010 est. | 262 | 35 |
| 141 |  Mongolia Mongolia |
1,860,000,000 | 2009 | 686 | 41 |
| 142 |  Chad Chad |
1,749,000,000 | 31 December 2008 est. | 160 | 21 |
| 143 |  Sierra Leone Sierra Leone |
1,610,000,000 | 2003 est. | 340 | 61 |
| 144 |  Papua New Guinea Papua New Guinea |
1,548,000,000 | 31 December 2010 est. | 238 | 16 |
| 145 |  Seychelles Seychelles |
1,374,000,000 | 31 December 2010 est. | 15,614 | 147 |
| 146 |  Malawi Malawi |
1,213,000,000 | 31 December 2010 est. | 77 | 24 |
| 147 |  Burundi Burundi |
1,200,000,000 | 2003 | 167 | 202 |
| 148 |  Central African Republic Central African Republic |
1,153,000,000 | 2007 est. | 270 | 68 |
| — |  West Bank West Bank |
1,040,000,000 | 2010 est. | 414 | 0 |
| 149 |  Belize Belize |
1,010,000,000 | 2009 est. | 3,079 | 75 |
| 150 |  Eritrea Eritrea |
961,900,000 | 31 December 2008 est. | 195 | 58 |
| 151 |  Maldives Maldives |
943,000,000 | 2010 est. | 2,947 | 50 |
| 152 |  Guinea-Bissau Guinea-Bissau |
941,500,000 | 2000 est. | 722 | 259 |
| 153 |  Bhutan Bhutan |
836,000,000 | 2009 | 1,193 | 64 |
| 154 |  Equatorial Guinea Equatorial Guinea |
832,000,000 | 31 December 2010 est. | 634 | 6 |
| 155 |  Guyana Guyana |
804,300,000 | 30 September 2008 | 1,049 | 42 |
| 156 |  Barbados Barbados |
668,000,000 | 2003 | 2,456 | 22 |
| 157 |  Kingdom of Montenegro Kingdom of Montenegro |
650,000,000 | 2006 | 939 | 24 |
| 158 |  Lesotho Lesotho |
647,000,000 | 31 December 2010 est. | 255 | 30 |
| 159 | 530,000,000 | 31 December 2010 est. | 306 | 50 | |
| 160 |  Suriname Suriname |
504,300,000 | 2005 est. | 1,011 | 28 |
| 161 |  Swaziland Swaziland |
497,000,000 | 31 December 2010 est. | 428 | 14 |
| 162 |  Saint Vincent and the Grenadines Saint Vincent and the Grenadines |
479,000,000 | 2010 est. | 4,477 | 85 |
| — |  Aruba Aruba |
478,600,000 | 2005 est. | 4,935 | 21 |
| 163 |  Djibouti Djibouti |
428,000,000 | 2006 | 573 | 56 |
| 164 |  Antigua and Barbuda Antigua and Barbuda |
359,800,000 | June 2006 | 4,388 | 36 |
| 165 |  Haiti Haiti |
350,000,000 | 31 December 2010 est. | 36 | 5 |
| 166 |  Grenada Grenada |
347,000,000 | 2004 | 3,402 | 74 |
| 167 | 342,600,000 | 2004 est. | 1,067 | 6 | |
| 168 |  Cape Verde Cape Verde |
325,000,000 | 2002 | 714 | 52 |
| 169 |  São Tomé and Príncipe São Tomé and Príncipe |
318,000,000 | 2002 | 2,193 | 349 |
| 170 |  Saint Kitts and Nevis Saint Kitts and Nevis |
314,000,000 | 2004 | 6,408 | 79 |
| 171 |  Saint Lucia Saint Lucia |
257,000,000 | 2004 | 1,586 | 32 |
| 172 |  Comoros Comoros |
232,000,000 | 2000 est. | 430 | 115 |
| 173 |  Dominica Dominica |
213,000,000 | 2004 | 3,000 | 75 |
| 174 |  Samoa Samoa |
177,000,000 | 2004 | 968 | 47 |
| 175 |  Solomon Islands Solomon Islands |
166,000,000 | 2004 | 355 | 44 |
| — |  Bermuda Bermuda |
160,000,000 | FY99/00 | 2,575 | 5 |
| — |  Cook Islands Cook Islands |
141,000,000 | 1996 est. | 7,756 | 0 |
| 176 |  Fiji Fiji |
127,000,000 | 2004 est. | 150 | 5 |
| 177 |  Marshall Islands Marshall Islands |
87,000,000 | 2008 est. | 1,377 | 54 |
| 178 |  Vanuatu Vanuatu |
81,200,000 | 2004 | 389 | 22 |
| 179 |  Tonga Tonga |
80,700,000 | 2004 | 799 | 33 |
| — |  New Caledonia New Caledonia |
79,000,000 | 1998 est. | 385 | 3 |
| — |  Cayman Islands Cayman Islands |
70,000,000 | 1996 | 2,078 | 7 |
| — |  Faroe Islands Faroe Islands |
68,100,000 | 2006 | 0 | 0 |
| 180 | 60,800,000 | FY05 est.
| 556 |
25 |
| |
| — |  Greenland Greenland |
58,000,000 | 2009 | 1,035 | 5 |
| — |  British Virgin Islands British Virgin Islands |
36,100,000 | 1997 | 0 | 0 |
| 181 |  Nauru Nauru |
33,300,000 | 2004 est. | 0 | 0 |
| 182 |  Kiribati Kiribati |
10,000,000 | 1999 est. | 120 | 14 |
| — |  Montserrat Montserrat |
8,900,000 | 1997 | 0 | 0 |
| — |  Anguilla Anguilla |
8,800,000 | 1998 | 0 | 0 |
| — |  Wallis and Futuna Wallis and Futuna |
3,670,000 | 2004 | 0 | 0 |
| — |  Niue Niue |
418,000 | 2002 est. | 0 | 0 |
| — |  Macau Macau |
0 | 2010 | 0 | 0 |
| 183 |  Republic of China Republic of China |
0 | 2005 | 0 | 0 |
| 184 |  Liechtenstein Liechtenstein |
0 | 2011 | 0 | 0 |
| 185 |  India India |
0 | 2001 | 0 | 0 |
| 186 |  Mainland China Mainland China |
0 | FY99/00 | 0 | 0 |
See also
- List of sovereign states by public debt
- Domestic Liability DollarizationDomestic liability dollarizationDomestic liability dollarization refers to the denomination of banking system deposits and lending in a currency other than that of the country in which they are held...
- List of sovereign states by external assets
- Net international investment positionNet international investment positionThe difference between a country's external financial assets and its liabilities is the net international investment position . Both public and private held external assets and liabilities by legal residents of the respective country are hereby taken into account...
- Balance of tradeBalance of tradeThe balance of trade is the difference between the monetary value of exports and imports of output in an economy over a certain period. It is the relationship between a nation's imports and exports...
External links
- www.jedh.org - Gross external debt (Joint External Debt Hub)
https://www.cia.gov/library/publications/the-world-factbook/rankorder/2079rank.html