

List of countries by GDP (real) growth rate
Encyclopedia
This list shows the increase in value of all final goods and services produced within a nation in a given year, taking into account inflation
.
.
Inflation
In economics, inflation is a rise in the general level of prices of goods and services in an economy over a period of time.When the general price level rises, each unit of currency buys fewer goods and services. Consequently, inflation also reflects an erosion in the purchasing power of money – a...
.
List
The figures are from the International Monetary FundInternational Monetary Fund
The International Monetary Fund is an organization of 187 countries, working to foster global monetary cooperation, secure financial stability, facilitate international trade, promote high employment and sustainable economic growth, and reduce poverty around the world...
.
| Rank | Country | Rate |
|---|---|---|
| 1 |  Qatar Qatar |
16.272 |
| 2 |  Singapore Singapore |
15.270 |
| 3 |  Paraguay Paraguay |
14.400 |
| 4 |  India India |
11.1 |
| 5 | 10.823 | |
| 6 |  People's Republic of China People's Republic of China |
10.300 |
| 7 |  Turkmenistan Turkmenistan |
9.222 |
| 8 |  Argentina Argentina |
9.161 |
| 9 |  Sri Lanka Sri Lanka |
9.134 |
| 10 | 9.090 | |
| 11 |  Zimbabwe Zimbabwe |
9.006 |
| 12 |  Peru Peru |
8.795 |
| 13 |  Botswana Botswana |
8.562 |
| 14 |  Uzbekistan Uzbekistan |
8.500 |
| 15 |  Uruguay Uruguay |
8.468 |
| 16 |  Nigeria Nigeria |
8.394 |
| 17 |  Afghanistan Afghanistan |
8.227 |
| 18 |  Turkey Turkey |
8.200 |
| 19 |  Yemen Yemen |
8.016 |
| 20 |  Ethiopia Ethiopia |
8.008 |
| 21 |  Maldives Maldives |
7.969 |
| 22 |  Thailand Thailand |
7.803 |
| 23 |  Dominican Republic Dominican Republic |
7.751 |
| 24 |  Laos Laos |
7.747 |
| 25 |  Zambia Zambia |
7.601 |
| 26 |  Philippines Philippines |
7.600 |
| 27 |  Belarus Belarus |
7.600 |
| 28 |  Niger Niger |
7.530 |
| 29 |  Panama Panama |
7.505 |
| 30 |  Lebanon Lebanon |
7.500 |
| 31 |  Brazil Brazil |
7.490 |
| 32 | 7.245 | |
| 33 |  Malaysia Malaysia |
7.156 |
| 34 |  Papua New Guinea Papua New Guinea |
7.030 |
| 35 |  Mozambique Mozambique |
7.009 |
| 36 |  Kazakhstan Kazakhstan |
7.000 |
| 37 |  Moldova Moldova |
6.900 |
| 38 |  Hong Kong Hong Kong |
6.812 |
| 39 |  Vietnam Vietnam |
6.784 |
| 40 |  Bhutan Bhutan |
6.731 |
| 41 |  Malawi Malawi |
6.602 |
| 42 |  Rwanda Rwanda |
6.500 |
| 43 |  Tajikistan Tajikistan |
6.500 |
| 44 |  Tanzania Tanzania |
6.500 |
| 45 |  Georgia (country) Georgia (country) |
6.377 |
| 46 |  Seychelles Seychelles |
6.236 |
| 47 |  Mongolia Mongolia |
6.140 |
| 48 |  South Korea South Korea |
6.110 |
| 49 |  Indonesia Indonesia |
6.105 |
| 50 |  East Timor East Timor |
6.050 |
| 51 |  Bangladesh Bangladesh |
6.023 |
| 52 |  Cambodia Cambodia |
6.022 |
| 53 |  Burkina Faso Burkina Faso |
5.805 |
| 54 |  Ghana Ghana |
5.735 |
| 55 |  The Gambia The Gambia |
5.730 |
| 56 |  Gabon Gabon |
5.692 |
| 57 |  Solomon Islands Solomon Islands |
5.566 |
| 58 |  Sweden Sweden |
5.536 |
| 59 |  Mexico Mexico |
5.518 |
| 60 |  Cape Verde Cape Verde |
5.410 |
| 61 |  Myanmar Myanmar |
5.262 |
| 62 |  Chile Chile |
5.260 |
| 63 |  Uganda Uganda |
5.182 |
| 64 |  Egypt Egypt |
5.147 |
| 65 |  Liberia Liberia |
5.147 |
| 66 |  Sudan Sudan |
5.067 |
| 67 |  Chad Chad |
5.055 |
| 68 |  Azerbaijan Azerbaijan |
5.000 |
| 69 |  Kenya Kenya |
4.983 |
| 70 |  Sierra Leone Sierra Leone |
4.950 |
| 71 |  Pakistan Pakistan |
4.792 |
| 72 |  Mauritania Mauritania |
4.662 |
| 73 |  Israel Israel |
4.606 |
| 74 |  Nepal Nepal |
4.578 |
| 75 |  Djibouti Djibouti |
4.510 |
| 76 |  São Tomé and Príncipe São Tomé and Príncipe |
4.500 |
| 77 |  Mali Mali |
4.460 |
| 78 |  Nicaragua Nicaragua |
4.480 |
| 79 |  Suriname Suriname |
4.423 |
| 80 |  Namibia Namibia |
4.379 |
| 81 |  Colombia Colombia |
4.308 |
| 82 |  Senegal Senegal |
4.244 |
| 83 |  Ukraine Ukraine |
4.214 |
| 84 |  Oman Oman |
4.210 |
| 85 |  Bolivia Bolivia |
4.187 |
| 86 |  Costa Rica Costa Rica |
4.172 |
| 87 |  Libya Libya |
4.164 |
| 88 |  Brunei Brunei |
4.097 |
| 89 |  Bahrain Bahrain |
4.086 |
| 90 |  Mauritius Mauritius |
4.035 |
| 91 | 4.021 | |
| 92 |  Russia Russia |
4 |
| 93 |  Japan Japan |
3.938 |
| 94 |  Burundi Burundi |
3.850 |
| 95 |  Poland Poland |
3.817 |
| 96 |  Saudi Arabia Saudi Arabia |
3.744 |
| 97 |  Tunisia Tunisia |
3.693 |
| 98 |  Malta Malta |
3.650 |
| 99 |  Guyana Guyana |
3.634 |
| 100 |  Germany Germany |
3.504 |
| 101 |  Albania Albania |
3.500 |
| 102 |  Guinea-Bissau Guinea-Bissau |
3.473 |
| 103 |  Togo Togo |
3.409 |
| 104 |  Luxembourg Luxembourg |
3.390 |
| 105 |  Algeria Algeria |
3.333 |
| 106 |  Central African Republic Central African Republic |
3.300 |
| 107 | 3.233 | |
| 108 |  United Arab Emirates United Arab Emirates |
3.229 |
| 109 |  Ecuador Ecuador |
3.200 |
| 110 |  Morocco Morocco |
3.150 |
| 111 |  Finland Finland |
3.122 |
| 112 |  Estonia Estonia |
3.105 |
| 113 |  Jordan Jordan |
3.093 |
| 114 |  Canada Canada |
3.071 |
| 115 |  Cameroon Cameroon |
3.000 |
| 116 |  United States United States |
2.834 |
| 117 |  South Africa South Africa |
2.784 |
| 118 |  Honduras Honduras |
2.773 |
| 119 |  Australia Australia |
2.747 |
| 120 |  Guatemala Guatemala |
2.615 |
| 121 |  Armenia Armenia |
2.600 |
| 122 |  Côte d'Ivoire Côte d'Ivoire |
2.568 |
| 123 |  Switzerland Switzerland |
2.552 |
| 124 |  Benin Benin |
2.452 |
| 125 |  Lesotho Lesotho |
2.444 |
| 126 |  Czech Republic Czech Republic |
2.318 |
| 127 |  Vanuatu Vanuatu |
2.245 |
| 128 |  Eritrea Eritrea |
2.194 |
| 129 |  Comoros Comoros |
2.140 |
| 130 |  Denmark Denmark |
2.076 |
| 131 |  Belize Belize |
2.000 |
| 132 |  Swaziland Swaziland |
1.986 |
| 133 |  Belgium Belgium |
1.973 |
| 134 |  Kuwait Kuwait |
1.966 |
| 135 |  Austria Austria |
1.961 |
| 136 |  Guinea Guinea |
1.937 |
| 137 |  Kiribati Kiribati |
1.800 |
| 138 |  Serbia Serbia |
1.762 |
| 139 |  Netherlands Netherlands |
1.748 |
| 140 |  Angola Angola |
1.610 |
| 141 |  New Zealand New Zealand |
1.518 |
| 142 |  Early Modern France Early Modern France |
1.486 |
| 143 |  Portugal Portugal |
1.398 |
| 144 |  Lithuania Lithuania |
1.330 |
| 145 |  Italy Italy |
1.296 |
| 146 |  United Kingdom United Kingdom |
1.251 |
| 147 |  Hungary Hungary |
1.210 |
| 148 |  Slovenia Slovenia |
1.200 |
| 149 |  Kingdom of Montenegro Kingdom of Montenegro |
1.078 |
| 150 |  Cyprus Cyprus |
1.041 |
| 151 |  Iran Iran |
1.029 |
| 152 |  Dominica Dominica |
0.970 |
| 153 |  Iraq Iraq |
0.844 |
| 154 |  Saint Lucia Saint Lucia |
0.842 |
| 155 |  Bosnia and Herzegovina Bosnia and Herzegovina |
0.800 |
| 156 |  El Salvador El Salvador |
0.746 |
| 157 | 0.700 | |
| 158 |  The Bahamas The Bahamas |
0.500 |
| 159 |  Norway Norway |
0.447 |
| 160 |  Tonga Tonga |
0.338 |
| 161 |  Tuvalu Tuvalu |
0.199 |
| 162 |  Kingdom of Bulgaria Kingdom of Bulgaria |
0.150 |
| 163 |  Fiji Fiji |
0.101 |
| 164 |  Trinidad and Tobago Trinidad and Tobago |
0.042 |
| 165 |  Samoa Samoa |
|
| 166 |  Spain Spain |
|
| 167 |  Latvia Latvia |
|
| 168 |  Barbados Barbados |
|
| 169 |  Equatorial Guinea Equatorial Guinea |
|
| 170 |  Jamaica Jamaica |
|
| 171 |  Kingdom of Romania Kingdom of Romania |
|
| 172 |  Kyrgyzstan Kyrgyzstan |
|
| 173 |  Republic of Ireland Republic of Ireland |
|
| 174 |  Independent State of Croatia Independent State of Croatia |
|
| 175 |  Grenada Grenada |
|
| 176 |  Saint Kitts and Nevis Saint Kitts and Nevis |
|
| 177 |  Venezuela Venezuela |
|
| 178 |  Madagascar Madagascar |
|
| 179 |  Saint Vincent and the Grenadines Saint Vincent and the Grenadines |
|
| 180 |  Iceland Iceland |
|
| 181 |  Antigua and Barbuda Antigua and Barbuda |
|
| 182 |  Haiti Haiti |
|
| 183 |  Greece Greece |
|
Asia
| Country | % Growth | Date of information | World Rank | Region Rank |
|---|---|---|---|---|
| Singapore |
14.5% | 2010 | 3 | 1 |
| India |
11.1% | 2010 | 4 | 2 |
| 10.8% | 2011 | 5 | 3 | |
 Mainland China Mainland China |
10.3% | 2010 | 6 | 4 |
| Sri Lanka |
9.1% | 2010 | 9 | 5 |
North America
| Country | % Growth | Date of information | World Rank | Continent Rank |
|---|---|---|---|---|
| Dominican Republic |
7.9% | 2010 | 23 | 1 |
| Panama |
7.5% | 2010 | 28 | 2 |
| Mexico |
5.5% | 2010 | 59 | 3 |
| Nicaragua |
4.5% | 2010 | 78 | 4 |
| Costa Rica |
4.2% | 2010 | 86 | 5 |
South America
| Country | % Growth | Date of information | World Rank | Continent Rank |
|---|---|---|---|---|
| Paraguay |
15.3% | 2010 | 2 | 1 |
| Argentina |
9.2% | 2010 | 8 | 2 |
| Peru |
8.8% | 2010 | 12 | 3 |
| Uruguay |
8.5% | 2010 | 15 | 4 |
| Brazil |
7.5% | 2010 | 30 | 5 |
Sub-Saharan Africa
| Country | % Growth | Date of information | World Rank | Region Rank |
|---|---|---|---|---|
| 9.1% | 2010 | 10 | 1 | |
| Zimbabwe |
9.0% | 2010 | 11 | 2 |
| Botswana |
8.6% | 2010 | 13 | 3 |
| Nigeria |
8.4% | 2010 | 16 | 4 |
| Ethiopia |
8.0% | 2010 | 20 | 9 |
Europe
| Country | % Growth | Date of information | World Rank | Continent Rank |
|---|---|---|---|---|
| Belarus |
7.6% | 2010 | 26 | 2 |
| Moldova |
6.9% | 2010 | 37 | 3 |
| Georgia (country) |
6.9% | 2010 | 45 | 4 |
| Kingdom of Bulgaria |
6.0% | 2011 | 53 | 5 |
Central Asia
| Country | % Growth | Date of information | World Rank | Region Rank |
|---|---|---|---|---|
| Turkmenistan |
9.2% | 2010 | 7 | 1 |
| Uzbekistan |
8.5% | 2010 | 14 | 2 |
| Kazakhstan |
7.0% | 2010 | 36 | 3 |
| Tajikistan |
6.5% | 2010 | 43 | 4 |
| -1.4% | 2010 | 173 | 5 |
Middle East and North Africa
| Country | % Growth | Date of information | World Rank | Region Rank |
|---|---|---|---|---|
| Qatar |
16.3% | 2010 | 1 | 1 |
| Afghanistan |
8.3% | 2010 | 17 | 2 |
| Turkey |
8.2% | 2010 | 18 | 1 |
| Yemen |
8.0% | 2010 | 24 | 3 |
| Lebanon |
7.5% | 2010 | 29 | 4 |
| Egypt |
5.1% | 2010 | 64 | 5 |
Oceania
| Country | % Growth | Date of information | World Rank | Continent Rank |
|---|---|---|---|---|
| Papua New Guinea |
7.0% | 2010 | 34 | 1 |
| Solomon Islands |
5.6% | 2010 | 57 | 2 |
| Australia |
2.7% | 2010 | 120 | 3 |
| Vanuatu |
2.2% | 2010 | 128 | 4 |
| New Zealand |
1.5% | 2010 | 142 | 5 |
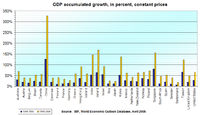
Long range data
For the comparison of economies long range data is more useful than one-year rates.Sources
- GDP (real) growth rate list by the CIACentral Intelligence AgencyThe Central Intelligence Agency is a civilian intelligence agency of the United States government. It is an executive agency and reports directly to the Director of National Intelligence, responsible for providing national security intelligence assessment to senior United States policymakers...
World FactbookThe World FactbookThe World Factbook is a reference resource produced by the Central Intelligence Agency of the United States with almanac-style information about the countries of the world. The official paper copy version is available from the National Technical Information Service and the Government Printing Office... - Economic information by country
External links
- Economics focus: Grossly distorted picture From Mar 13th 2008, The Economist print edition. Sub-title "If you look at GDP per head, the world is a different—and, by and large, a better—place"
- World Map and Chart of GDP Annual Growth % by lebanese-economy-forum, World Bank data