
Heat map
Encyclopedia
A heat map is a graphical representation of data where the values taken by a variable
in a two-dimensional table are represented as colors. Fractal maps and tree maps both often use a similar system of color-coding to represent the values taken by a variable in a hierarchy
. The term is also used to mean its thematic
application as a choropleth map
.
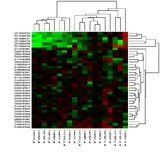
Heat maps originated in 2D displays of the values in a data matrix. Larger values were represented by small dark gray or black squares (pixels) and smaller values by lighter squares. Sneath (1957) displayed the results of a cluster analysis by permuting the rows and the columns of a matrix to place similar values near each other according to the clustering. Jacques Bertin
used a similar representation to display data that conformed to a Guttman scale
. The idea for joining cluster trees to the rows and columns of the data matrix originated with Robert Ling in 1973. Ling used overstruck printer characters to represent different shades of gray, one character-width per pixel. Leland Wilkinson
developed the first computer program in 1994 (SYSTAT
) to produce cluster heat maps with high-resolution color graphics. The Eisen et al. display shown in the figure is a replication of the earlier SYSTAT design.
 There are several different kinds of heat map:
Variable (mathematics)
In mathematics, a variable is a value that may change within the scope of a given problem or set of operations. In contrast, a constant is a value that remains unchanged, though often unknown or undetermined. The concepts of constants and variables are fundamental to many areas of mathematics and...
in a two-dimensional table are represented as colors. Fractal maps and tree maps both often use a similar system of color-coding to represent the values taken by a variable in a hierarchy
Hierarchy
A hierarchy is an arrangement of items in which the items are represented as being "above," "below," or "at the same level as" one another...
. The term is also used to mean its thematic
Thematic map
A thematic map is a type of map or chart especially designed to show a particular theme connected with a specific geographic area. These maps "can portray physical, social, political, cultural, economic, sociological, agricultural, or any other aspects of a city, state, region,nation , or...
application as a choropleth map
Choropleth map
A choropleth map A choropleth map A choropleth map (Greek χώρος + πληθαίν:, ("area/region" + "multiply") is a thematic map in which areas are shaded or patterned in proportion to the measurement of the statistical variable being displayed on the map, such as population density or per-capita...
.
Heat maps originated in 2D displays of the values in a data matrix. Larger values were represented by small dark gray or black squares (pixels) and smaller values by lighter squares. Sneath (1957) displayed the results of a cluster analysis by permuting the rows and the columns of a matrix to place similar values near each other according to the clustering. Jacques Bertin
Jacques Bertin
Jacques Bertin was a French cartographer and theorist, known from his book Semiologie Graphique , edited in 1967...
used a similar representation to display data that conformed to a Guttman scale
Guttman scale
In statistical surveys conducted by means of structured interviews or questionnaires, a subset of the survey items having binary answers forms a Guttman scale if they can be ranked in some order so that, for a rational respondent, the response pattern can be captured by a single index on that...
. The idea for joining cluster trees to the rows and columns of the data matrix originated with Robert Ling in 1973. Ling used overstruck printer characters to represent different shades of gray, one character-width per pixel. Leland Wilkinson
Leland Wilkinson
Leland Wilkinson is a statistician and computer scientist at SYSTAT Software Inc. Dr. Wilkinson developed SYSTAT in the early 1980s, sold it to SPSS in 1995, and now serves as Executive VP of SYSTAT Software Inc. in Chicago. His research focuses on scientific visualization and statistical...
developed the first computer program in 1994 (SYSTAT
SYSTAT
SYSTAT is a statistics and statistical graphics software package, developed by Leland Wilkinson in the late 1970s, who was at the time an assistant professor of psychology at the University of Illinois at Chicago...
) to produce cluster heat maps with high-resolution color graphics. The Eisen et al. display shown in the figure is a replication of the earlier SYSTAT design.
- Web heat maps have been used for displaying areas of a Web page most frequently scanned by visitors.
- Biology heat maps are typically used in molecular biologyMolecular biologyMolecular biology is the branch of biology that deals with the molecular basis of biological activity. This field overlaps with other areas of biology and chemistry, particularly genetics and biochemistry...
to represent the level of expression of many genes across a number of comparable samples (e.g. cellsCell (biology)The cell is the basic structural and functional unit of all known living organisms. It is the smallest unit of life that is classified as a living thing, and is often called the building block of life. The Alberts text discusses how the "cellular building blocks" move to shape developing embryos....
in different states, samples from different patients) as they are obtained from DNA microarrays. - The tree map is a 2D hierarchical partitioning of data that visually resembles a heat map.
- A mosaic plot is a tiled heat map for representing a two-way or higher-way table of data. As with treemaps, the rectangular regions in a mosaic plot are hierarchically organized. The means that the regions are rectangles instead of squares. Friendly (1994) surveys the history and usage of this graph.
Software Implementations
Several heat map software implementations are listed here (the list is not complete):- FusionCharts Heat Map, a charting component for visual data, has support for real-time, interactive heat maps http://www.fusioncharts.com/powercharts/charts/heat-map/
- R Statistics, a free software environment for statistical computing and graphics, contains several functions to trace heat maps http://www2.warwick.ac.uk/fac/sci/moac/currentstudents/peter_cock/r/heatmap/
- GnuplotGnuplot- License :Despite gnuplot's name, it is not part of or related to the GNU system and it is not distributed under the GNU General Public License .However, some GNU packages do use gnuplot....
, a universal and free command-line plotting program, can trace 2D and 3D heat maps http://gnuplot.sourceforge.net/demo_4.4/heatmaps.html - The Google Docs spreadsheet application includes a Heat Map gadget.
- QlucoreQlucoreQlucore is a company from Lund, Sweden, that provides bioinformatics software for the life science and biotech industries.The software Qlucore Omics Explorer analyzes data sets such as*Gene expression: microarrays, real-time PCR...
includes a heat map that is dynamically updated when filter parameters are changed. - The ESPN Gamecast for soccer games uses heat maps to show where certain players have spent time on the field.
- By searching the List of bioinformatics companies more tools for heat maps can be found.
- Microsoft Excel can be used to generate heat maps using the Surface Chart. Though the default color range for Surface Charts in Excel is not conducive to heat maps, the colors can be edited to generate user-friendly and intuitive heat maps.
External links
- The History of the Cluster Heat Map. Leland Wilkinson and Michael Friendly.
- Heatmap Builder. Heatmap Builder, a program for generating heatmaps developed at the Ashley Labs.
- Matrix2png . Web-based or command-line generation of heat maps.
- http://www.panopticon.com/demo_gallery/view-urls.php?id=104. A Map of the Market using a heatmap data visualization and London Stock ExchangeLondon Stock ExchangeThe London Stock Exchange is a stock exchange located in the City of London within the United Kingdom. , the Exchange had a market capitalisation of US$3.7495 trillion, making it the fourth-largest stock exchange in the world by this measurement...
data (FTSE 100 IndexFTSE 100 IndexThe FTSE 100 Index, also called FTSE 100, FTSE, or, informally, the footsie , is a share index of the 100 most highly capitalised UK companies listed on the London Stock Exchange....
) from Panopticon SoftwarePanopticon SoftwarePanopticon Software is a multi-national Data Visualization software company specializing in monitoring and analysis of real-time data. The firm is headquartered in Stockholm, Sweden, with additional offices in New York City, London, Boston and partner agreements for other markets around the world... - NASDAQ 100 Heatmap. Heatmap visualization of NASDAQ 100 index.
- heatmap.js. Open Source JavaScript library for generating realtime web heatmaps
- heatcanvas. Another open source library for modern web browser.