
Fluorescence interference contrast microscopy
Encyclopedia
Fluorescence interference contrast (FLIC) microscopy is a microscopic
technique developed to achieve z-resolution on the nanometer scale.
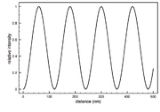
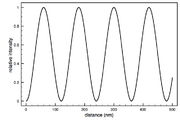
FLIC occurs whenever fluorescent objects are in the vicinity of a reflecting surface (e.g. Si wafer). The resulting interference between the direct and the reflected light leads to a double sin2 modulation of the intensity, I, of a fluorescent object as a function of distance, h, above the reflecting surface. This allows for the nanometer height measurements.
FLIC microscope is well suited to measuring the topography of a membrane that contains fluorescent
probes e.g. an artificial lipid bilayer
, or a living cell membrane
or the structure of fluorescently labeled protein
s on a surface.
and the distance of the fluorophore from a reflective silicon
surface.
The observed fluorescence intensity, , is the product of the excitation probability per unit time,
  , and the probability of measuring an emitted photon per unit time,
  . Both probabilities are a function of the fluorophore height above the silicon surface, so the observed intensity will also be a function of the fluorophore height. The simplest arrangement to consider is a fluorophore embedded in silicon dioxide (refractive index
  ) a distance d from an interface with silicon (refractive index
  ). The fluorophore is excited by light of wavelength
  and emits light of wavelength
  . The unit vector
  gives the orientation of the transition dipole
of excitation of the fluorophore. is proportional to the squared projection of the local electric field
, , which includes the effects of interference, on the direction of the transition dipole.
The local electric field, , at the fluorophore is affected by interference between the direct incident light and the light reflecting off the silicon surface. The interference is quantified by the phase difference
  given by
 is the angle of the incident light with respect to the silicon plane normal. Not only does interference modulate
  , but the silicon surface does not perfectly reflect the incident light. Fresnel coefficients give the change in amplitude between an incident and reflected wave. The Fresnel coefficients
depend on the angles of incidence, and
and  , the indices of refraction of the two mediums and the polarization direction. The angles
  and
and  can be related by Snell's Law
. The expressions for the reflection coefficients are:
TE refers to the component of the electric field perpendicular to the plane of incidence and TM to the parallel component (The incident plane is defined by the plane normal and the propagation direction of the light). In cartesian
coordinates, the local electric field is
 is the polarization angle of the incident light with respect to the plane of incidence. The orientation of the excitation dipole is a function of its angle
  to the normal and
  azimuthal to the plane of incidence.
The above two equations for and
and  can be combined to give the probability of exciting the fluorophore per unit time
  .
.
Many of the parameters used above would vary in a normal experiment. The variation in the five following parameters should be included in this theoretical description.
The squared projection must be averaged over these quantities to give the probability of excitation
  . Averaging over the first 4 parameters gives


 Normalization factors are not included.
  is a distribution of the orientation angle of the fluorophore dipoles. The azimuthal
angle and the polarization angle
  are integrated over analytically, so they no longer appear in the above equation. To finally obtain the probability of excitation per unit time, the above equation is integrated over the spread in excitation wavelength, accounting for the intensity
  and the extinction coefficient of the fluorophore
  .
.

The steps to calculate are equivalent to those above in calculating
  except that the parameter labels em are replaced with ex and in is replaced with out.

The resulting fluorescence intensity measured is proportional to the product of the excitation probability and emission probability

It is important to note that this theory determines a proportionality relation between the measured fluorescence intensity and the distance of the fluorophore above the reflective surface. The fact that it is not an equality relation will have a significant effect on the experimental procedure.
layer is then thermally grown on top of the silicon wafer to act as a spacer. On top of the oxide is placed the fluorescently labeled specimen, such as a lipid membrane, a cell or membrane bound proteins.
With the sample system built, all that is needed is an epifluorescence microscope and a CCD
camera to make quantitative intensity measurements.
 The silicon dioxide thickness is very important in making accurate FLIC measurements. As mentioned before, the theoretical model describes the relative fluorescence intensity measured versus the fluorophore height. The fluorophore position cannot be simply read off of a single measured FLIC curve. The basic procedure is to manufacture the oxide layer with at least two known thicknesses (the layer can be made with photolithographic
techniques and the thickness measured by ellipsometry
). The thicknesses used depends on the sample being measured. For a sample with fluorophore height in the range of 10 nm, oxide thickness around 50 nm would be best because the FLIC intensity curve is steepest here and would produce the greatest contrast between fluorophore heights. Oxide thickness above a few hundred nanometers could be problematic because the curve begins to get smeared out by polychromatic light and a range of incident angles. A ratio of measured fluorescence intensities at different oxide thicknesses is compared to the predicted ratio to calculate the fluorophore height above the oxide ( ).
).
The above equation can then be solved numerically to find .
.
Imperfections of the experiment , such as imperfect reflection, nonnormal incidence of light and polychromatic light tend to smear out the sharp fluorescence curves. The spread in incidence angle can be controlled by the numerical aperture
(N.A.). However, depending on the numerical aperture used, the experiment will yield good lateral resolution
(x-y) or good vertical resolution (z), but not both. A high N.A. (~1.0) gives good lateral resolution which is best if the goal is to determine long range topography. Low N.A. (~0.001), on the other hand, provides accurate z-height measurement to determine the height of a fluorescently labeled molecule in a system.
 The basic analysis involves fitting
the intensity data with the theoretical model allowing the distance of the fluorophore above the oxide surface ( ) to be a free parameter.
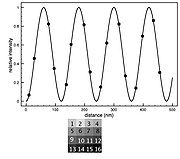
The FLIC curves shift to the left as the distance of the fluorophore above the oxide increases. is usually the parameter of interest, but several other free parameters are often included to optimize the fit. Normally an amplitude factor (a) and a constant additive term for the background (b) are included. The amplitude factor scales the relative model intensity and the constant background shifts the curve up or down to account for fluorescence coming from out of focus areas, such as the top side of a cell. Occasionally the numerical aperture (N.A.) of the microscope is allowed to be a free parameter in the fitting. The other parameters entering the optical theory, such as different indices of refraction, layer thicknesses and light wavelengths, are assumed constant with some uncertainty.
A FLIC chip may be made with oxide terraces of 9 or 16 different heights arranged in blocks. After a fluorescence image is captured, each 9 or 16 terrace block yields a separate FLIC curve that defines a unique . The average
  is found by compiling all the
  values into a histogram.
The statistical error in the calculation of comes from two sources: the error in fitting of the optical theory to the data and the uncertainty in the thickness of the oxide layer. Systematic error
comes from three sources: the measurement of the oxide thickness (usually by ellipsometer), the fluorescence intensity measurement with the CCD, and the uncertainty in the parameters used in the optical theory. The systematic error has been estimated to be .
.
Microscopy
Microscopy is the technical field of using microscopes to view samples and objects that cannot be seen with the unaided eye...
technique developed to achieve z-resolution on the nanometer scale.
FLIC occurs whenever fluorescent objects are in the vicinity of a reflecting surface (e.g. Si wafer). The resulting interference between the direct and the reflected light leads to a double sin2 modulation of the intensity, I, of a fluorescent object as a function of distance, h, above the reflecting surface. This allows for the nanometer height measurements.
FLIC microscope is well suited to measuring the topography of a membrane that contains fluorescent
probes e.g. an artificial lipid bilayer
Lipid bilayer
The lipid bilayer is a thin membrane made of two layers of lipid molecules. These membranes are flat sheets that form a continuous barrier around cells. The cell membrane of almost all living organisms and many viruses are made of a lipid bilayer, as are the membranes surrounding the cell nucleus...
, or a living cell membrane
Cell membrane
The cell membrane or plasma membrane is a biological membrane that separates the interior of all cells from the outside environment. The cell membrane is selectively permeable to ions and organic molecules and controls the movement of substances in and out of cells. It basically protects the cell...
or the structure of fluorescently labeled protein
Protein
Proteins are biochemical compounds consisting of one or more polypeptides typically folded into a globular or fibrous form, facilitating a biological function. A polypeptide is a single linear polymer chain of amino acids bonded together by peptide bonds between the carboxyl and amino groups of...
s on a surface.
General two layer system
The optical theory underlying FLIC was developed by Armin Lambacher and Peter Fromherz. They derived a relationship between the observed fluorescence intensityIntensity (physics)
In physics, intensity is a measure of the energy flux, averaged over the period of the wave. The word "intensity" here is not synonymous with "strength", "amplitude", or "level", as it sometimes is in colloquial speech...
and the distance of the fluorophore from a reflective silicon
Silicon
Silicon is a chemical element with the symbol Si and atomic number 14. A tetravalent metalloid, it is less reactive than its chemical analog carbon, the nonmetal directly above it in the periodic table, but more reactive than germanium, the metalloid directly below it in the table...
surface.
The observed fluorescence intensity,
, is the product of the excitation probability per unit time, , and the probability of measuring an emitted photon per unit time, . Both probabilities are a function of the fluorophore height above the silicon surface, so the observed intensity will also be a function of the fluorophore height. The simplest arrangement to consider is a fluorophore embedded in silicon dioxide (refractive index ) a distance d from an interface with silicon (refractive index ). The fluorophore is excited by light of wavelength and emits light of wavelength . The unit vector gives the orientation of the transition dipoleDipole
In physics, there are several kinds of dipoles:*An electric dipole is a separation of positive and negative charges. The simplest example of this is a pair of electric charges of equal magnitude but opposite sign, separated by some distance. A permanent electric dipole is called an electret.*A...
of excitation of the fluorophore.
is proportional to the squared projection of the local electric fieldElectric field
In physics, an electric field surrounds electrically charged particles and time-varying magnetic fields. The electric field depicts the force exerted on other electrically charged objects by the electrically charged particle the field is surrounding...
,
, which includes the effects of interference, on the direction of the transition dipole.The local electric field,
, at the fluorophore is affected by interference between the direct incident light and the light reflecting off the silicon surface. The interference is quantified by the phase difference given by is the angle of the incident light with respect to the silicon plane normal. Not only does interference modulate , but the silicon surface does not perfectly reflect the incident light. Fresnel coefficients give the change in amplitude between an incident and reflected wave. The Fresnel coefficientsFresnel diffraction
In optics, the Fresnel diffraction equation for near-field diffraction, is an approximation of Kirchhoff-Fresnel diffraction that can be applied to the propagation of waves in the near field....
depend on the angles of incidence,
and , the indices of refraction of the two mediums and the polarization direction. The angles and can be related by Snell's LawSnell's law
In optics and physics, Snell's law is a formula used to describe the relationship between the angles of incidence and refraction, when referring to light or other waves passing through a boundary between two different isotropic media, such as water and glass...
. The expressions for the reflection coefficients are:
TE refers to the component of the electric field perpendicular to the plane of incidence and TM to the parallel component (The incident plane is defined by the plane normal and the propagation direction of the light). In cartesian
Cartesian coordinate system
A Cartesian coordinate system specifies each point uniquely in a plane by a pair of numerical coordinates, which are the signed distances from the point to two fixed perpendicular directed lines, measured in the same unit of length...
coordinates, the local electric field is
is the polarization angle of the incident light with respect to the plane of incidence. The orientation of the excitation dipole is a function of its angle to the normal and azimuthal to the plane of incidence.The above two equations for
and can be combined to give the probability of exciting the fluorophore per unit time .Many of the parameters used above would vary in a normal experiment. The variation in the five following parameters should be included in this theoretical description.
- The coherenceCoherence (physics)In physics, coherence is a property of waves that enables stationary interference. More generally, coherence describes all properties of the correlation between physical quantities of a wave....
of the excitation light - The incident angle (
 ) of excitation light
 - Polarization angle (
 ) of the excitation light
 - The angle of transition dipole (
 ) of the fluorophore
 - The wavelength of the excitation light (
 )
)
The squared projection
must be averaged over these quantities to give the probability of excitation . Averaging over the first 4 parameters gives is a distribution of the orientation angle of the fluorophore dipoles. The azimuthalPolar coordinate system
In mathematics, the polar coordinate system is a two-dimensional coordinate system in which each point on a plane is determined by a distance from a fixed point and an angle from a fixed direction....
angle
and the polarization angle are integrated over analytically, so they no longer appear in the above equation. To finally obtain the probability of excitation per unit time, the above equation is integrated over the spread in excitation wavelength, accounting for the intensity and the extinction coefficient of the fluorophore .The steps to calculate
are equivalent to those above in calculating except that the parameter labels em are replaced with ex and in is replaced with out.The resulting fluorescence intensity measured is proportional to the product of the excitation probability and emission probability
It is important to note that this theory determines a proportionality relation between the measured fluorescence intensity
and the distance of the fluorophore above the reflective surface. The fact that it is not an equality relation will have a significant effect on the experimental procedure.Experimental Setup
A silicon wafer is typically used as the reflective surface in a FLIC experiment. An oxideSilicon dioxide
The chemical compound silicon dioxide, also known as silica , is an oxide of silicon with the chemical formula '. It has been known for its hardness since antiquity...
layer is then thermally grown on top of the silicon wafer to act as a spacer. On top of the oxide is placed the fluorescently labeled specimen, such as a lipid membrane, a cell or membrane bound proteins.
With the sample system built, all that is needed is an epifluorescence microscope and a CCD
Charge-coupled device
A charge-coupled device is a device for the movement of electrical charge, usually from within the device to an area where the charge can be manipulated, for example conversion into a digital value. This is achieved by "shifting" the signals between stages within the device one at a time...
camera to make quantitative intensity measurements.
Photolithography
Photolithography is a process used in microfabrication to selectively remove parts of a thin film or the bulk of a substrate. It uses light to transfer a geometric pattern from a photomask to a light-sensitive chemical "photoresist", or simply "resist," on the substrate...
techniques and the thickness measured by ellipsometry
Ellipsometry
Ellipsometry is an optical technique for the investigation of the dielectric properties of thin films....
). The thicknesses used depends on the sample being measured. For a sample with fluorophore height in the range of 10 nm, oxide thickness around 50 nm would be best because the FLIC intensity curve is steepest here and would produce the greatest contrast between fluorophore heights. Oxide thickness above a few hundred nanometers could be problematic because the curve begins to get smeared out by polychromatic light and a range of incident angles. A ratio of measured fluorescence intensities at different oxide thicknesses is compared to the predicted ratio to calculate the fluorophore height above the oxide (
).The above equation can then be solved numerically to find
.Imperfections of the experiment , such as imperfect reflection, nonnormal incidence of light and polychromatic light tend to smear out the sharp fluorescence curves. The spread in incidence angle can be controlled by the numerical aperture
Numerical aperture
In optics, the numerical aperture of an optical system is a dimensionless number that characterizes the range of angles over which the system can accept or emit light. By incorporating index of refraction in its definition, NA has the property that it is constant for a beam as it goes from one...
(N.A.). However, depending on the numerical aperture used, the experiment will yield good lateral resolution
Optical resolution
Optical resolution describes the ability of an imaging system to resolve detail in the object that is being imaged.An imaging system may have many individual components including a lens and recording and display components...
(x-y) or good vertical resolution (z), but not both. A high N.A. (~1.0) gives good lateral resolution which is best if the goal is to determine long range topography. Low N.A. (~0.001), on the other hand, provides accurate z-height measurement to determine the height of a fluorescently labeled molecule in a system.
Analysis
Curve fitting
Curve fitting is the process of constructing a curve, or mathematical function, that has the best fit to a series of data points, possibly subject to constraints. Curve fitting can involve either interpolation, where an exact fit to the data is required, or smoothing, in which a "smooth" function...
the intensity data with the theoretical model allowing the distance of the fluorophore above the oxide surface (
) to be a free parameter.The FLIC curves shift to the left as the distance of the fluorophore above the oxide increases.
is usually the parameter of interest, but several other free parameters are often included to optimize the fit. Normally an amplitude factor (a) and a constant additive term for the background (b) are included. The amplitude factor scales the relative model intensity and the constant background shifts the curve up or down to account for fluorescence coming from out of focus areas, such as the top side of a cell. Occasionally the numerical aperture (N.A.) of the microscope is allowed to be a free parameter in the fitting. The other parameters entering the optical theory, such as different indices of refraction, layer thicknesses and light wavelengths, are assumed constant with some uncertainty.A FLIC chip may be made with oxide terraces of 9 or 16 different heights arranged in blocks. After a fluorescence image is captured, each 9 or 16 terrace block yields a separate FLIC curve that defines a unique
. The average is found by compiling all the values into a histogram.The statistical error in the calculation of
comes from two sources: the error in fitting of the optical theory to the data and the uncertainty in the thickness of the oxide layer. Systematic errorSystematic error
Systematic errors are biases in measurement which lead to the situation where the mean of many separate measurements differs significantly from the actual value of the measured attribute. All measurements are prone to systematic errors, often of several different types...
comes from three sources: the measurement of the oxide thickness (usually by ellipsometer), the fluorescence intensity measurement with the CCD, and the uncertainty in the parameters used in the optical theory. The systematic error has been estimated to be
.