

Event Chain Diagrams
Encyclopedia
Event chain diagram are introduced as a part of event chain methodology
Event chain methodology
Event chain methodology is an uncertainty modeling and schedule network analysis technique that is focused on identifying and managing events and event chains that affect project schedules...
. Event chain methodology is an uncertainty modeling and schedule network analysis
Network analysis
Network analysis can refer to:* Analysis of general networks: see Network theory.* Electrical network analysis see Network analysis .* Social network analysis.You may also be interested in Network planning and design...
technique that is focused on identifying and managing events and event chains that affect project schedules. Event chain methodology is the next advance beyond critical path method
Critical path method
The critical path method is an algorithm for scheduling a set of project activities. It is an important tool for effective project management.-History:...
and critical chain
Critical chain
Critical chain project management is a method of planning and managing projects that puts the main emphasis on the resources required to execute project tasks. It was developed by Eliyahu M. Goldratt. This is in contrast to the more traditional critical path and PERT methods, which emphasize task...
project management.
Rules
Event chain diagrams are presented on the Gantt chartGantt chart
A Gantt chart is a type of bar chart that illustrates a project schedule. Gantt charts illustrate the start and finish dates of the terminal elements and summary elements of a project. Terminal elements and summary elements comprise the work breakdown structure of the project. Some Gantt charts...
according to the specification.
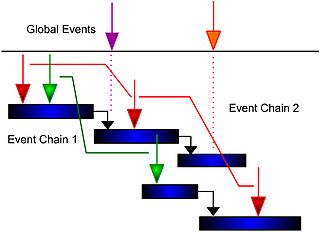
This specification is a set of rules, which can be understandable by anybody using this diagram:
- All events are shown as arrows. Names and/or IDs of events are shown next to the arrow.
- Events with negative impacts (risks) are represented by down arrows; events with positive impacts (opportunities) are represented by up arrows.
- Individual events are connected by lines representing the event chain.
- A sender event with multiple connecting lines to receivers represents multicasting.
- Events affecting all activities (global events) are shown outside Gantt chart. Threats are shown at the top of the diagram. Opportunities are shown at the bottom of the diagram.
Often event chain diagrams can become very complex. In these cases, some details of the
diagram do not need to be shown.
Optional rules
- Horizontal positions of the event arrows on the Gantt bar correspond with the mean moment of the event.
- Probability of an event can be shown next to the event arrow.
- Size of the arrow represents relative probability of an event. If the arrow is small, the probability of the event is correspondingly small.
- Multiple diagrams may be required to represent different event chains for the same schedule.
- Different colors can be use to represent different events (arrows) and connecting lines associated with different chains.
The central purpose of event chain diagrams is not to show all possible individual events.
Rather, event chain diagrams can be used to understand the relationship between events.
Therefore, it is recommended the event chain diagrams be used only for the most significant
events during the event identification and analysis stage. Event chain diagrams can be used as part of the risk identification process, particularly during brainstorming meetings. Members of project teams can draw arrows between associated with activities on the Gantt chart. Event chain diagrams can be used together with other diagramming tools.
The simplest way to represent these chains is to depict them as arrows associated with certain tasks or time intervals on the Gantt chart. Different events and event chains can be displayed using different colors. Events can be global (for all tasks in the project) and local (for a particular task). By using event chain diagrams to visualize events and event chains, the modeling and analysis of risks and uncertainties can be significantly simplified.