

Electrical Cardiometry
Encyclopedia
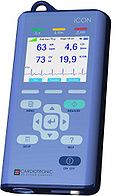
Electrical Cardiometry is a method based on the model of Electrical Velocimetry, and non-invasively measures stroke volume
(SV), cardiac output
(CO), and other hemodynamic parameters through the use of 4 surface ECG electrodes. Electrical Cardiometry is a method trademarked by Cardiotronic, Inc., and is U.S. FDA approved for use on adults, children, and neonates.
can be expressed as the superposition of three components:

where Z0 is the quasi-static portion of the electrical impedance
(base impedance), ΔZR are the changes of impedance due to the respiratory cycle, and ΔZC are the changes of impedance due to the cardiac cycle. ΔZR is considered an artifact akin to the estimation of stroke volume and is therefore suppressed. Exclusion of derived volumetric data may diminish the overall product.
The timely measurement of ΔZC (dZ(t)) reveals a waveform with shape similar to an arterial pressure waveform. The calculated first time derivative of dZ(t) is the waveform, which contains landmarks that allow determination of left-ventricular ejection time (LVET) and peak aortic blood acceleration. The peak aortic blood acceleration occurs at the steepest slope of the dZ(t) waveform, and at the peak of the
  waveform.
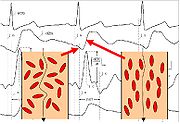 Prior to opening of the aortic valve, the red blood cells (erythrocytes) assume a random orientation (there is no blood flow in the aorta). When the electric current is applied from the outer electrodes, the current must circumference these red blood cells, therefore resulting in a higher voltage measurement, and thus, a lower conductivity. Shortly after aortic valve opening, the pulsatile blood flow forces the red blood cells to align in parallel with the blood flow. When the electric current is then applied, it is able to easily pass the red blood cells in the aorta resulting in a lower voltage, and thus, a higher conductivity. The change from random orientation to alignment of red blood cells upon opening of aortic valve generates a characteristic steep increase of conductivity or dZ(t) (corresponding to a steep decrease of impedance) – beat to beat.
The model considers the peak amplitude of divided by the base impedance Z0 as an index for peak aortic acceleration, and as an index of contractility of the heart, or ICON. The general equation for estimating stroke volume by means of thoracic electrical bioimpedance calculates the product of a patient constant CP (in ml), the mean blood velocity index
  FT (measured in s−1 during flow time, and FT (flow time measured in s):

The model of Electrical Velocimetry derives the mean blood velocity index FT from the measured index for peak aortic acceleration ICON. The higher the mean blood velocity during flow time, the more SV the left ventricle ejects. The 'volume of electrically participating tissue' (VEPT) is used as the patient constant. The VEPT is derived primarily from the body mass.
is a method of non-invasively monitoring hemodynamics, through the use of 4 dual sensors placed on the neck and chest. Both Impedance cardiography and Electrical Cardiometry derive SV and CO from measurements of TEB, but the underlying model is what differs. The Impedance Cardiography model contributes the rapid change of bioimpedance which occurs shortly after aortic valve opening to the expansion of the compliant ascending aorta, assuming that more blood volume temporarily stored in the ascending aorta contributes to a decrease in bioimpedance (or an increase in conductity of the thorax). The underlying model never proved accurate in patients with small cardiac outputs, hence it was never U.S. FDA approved for use in children or neonates.
Stroke volume
In cardiovascular physiology, stroke volume is the volume of blood pumped from one ventricle of the heart with each beat. SV is calculated using measurements of ventricle volumes from an echocardiogram and subtracting the volume of the blood in the ventricle at the end of a beat from the volume...
(SV), cardiac output
Cardiac output
Cardiac output is the volume of blood being pumped by the heart, in particular by a left or right ventricle in the time interval of one minute. CO may be measured in many ways, for example dm3/min...
(CO), and other hemodynamic parameters through the use of 4 surface ECG electrodes. Electrical Cardiometry is a method trademarked by Cardiotronic, Inc., and is U.S. FDA approved for use on adults, children, and neonates.
Overview
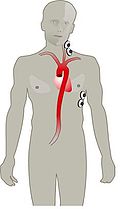
- The method of Electrical Cardiometry requires the use of 4 ECG electrodes, 2 attached to the left side of the neck and 2 attached at the lower thorax.
- An electrical alternating current (AC) of constant amplitude is applied via the pair of outer electrodes toward the thorax and in particular the ascending and descending aortaAortaThe aorta is the largest artery in the body, originating from the left ventricle of the heart and extending down to the abdomen, where it branches off into two smaller arteries...
. - Current is directed toward the aorta because blood is the most conductive material in the thorax.
- The ratio of applied current and measured voltage equals the conductivity (or bioimpedanceBioimpedanceIn biomedical engineering, bioimpedance is a term used to describe the response of a living organism to an externally applied electric current. It is a measure of the opposition to the flow of that electric current through the tissues, the opposite of electrical conductivity[1]...
), which is recorded over time. - The steep increase in conductivity seen beat to beat is attributed to the orientation of red blood cells. The time when the slope is most steep is directly related to the peak aortic blood acceleration.
- Electrical Cardiometry is similar to Impedance cardiographyImpedance cardiographyImpedance cardiography is a plethysmography technique of using sensors to detect the properties of the blood flow in the thorax.-Introduction:...
in the fact that both methods measure thoracic electrical bioimpedance (TEB). The methods differ from what phenomenon is responsible for the steep increase in TEB per heart beat.
Theory
The measured bioimpedance over timeTime
Time is a part of the measuring system used to sequence events, to compare the durations of events and the intervals between them, and to quantify rates of change such as the motions of objects....
can be expressed as the superposition of three components:
where Z0 is the quasi-static portion of the electrical impedance
Electrical impedance
Electrical impedance, or simply impedance, is the measure of the opposition that an electrical circuit presents to the passage of a current when a voltage is applied. In quantitative terms, it is the complex ratio of the voltage to the current in an alternating current circuit...
(base impedance), ΔZR are the changes of impedance due to the respiratory cycle, and ΔZC are the changes of impedance due to the cardiac cycle. ΔZR is considered an artifact akin to the estimation of stroke volume and is therefore suppressed. Exclusion of derived volumetric data may diminish the overall product.
The timely measurement of ΔZC (dZ(t)) reveals a waveform with shape similar to an arterial pressure waveform. The calculated first time derivative of dZ(t) is the
waveform, which contains landmarks that allow determination of left-ventricular ejection time (LVET) and peak aortic blood acceleration. The peak aortic blood acceleration occurs at the steepest slope of the dZ(t) waveform, and at the peak of the waveform.Electrical Velocimetry
Electrical Velocimetry (EV) is the model which Electrical Cardiometry is based. EV is based on the fact that the conductivity of the blood in the aorta changes during the cardiac cycle. EV was developed by Dr. Bernstein and Dr. Osypka in 2001, as a new model for interperating the bioimpedance signals of the thorax.The model considers the peak amplitude of
divided by the base impedance Z0 as an index for peak aortic acceleration, and as an index of contractility of the heart, or ICON. The general equation for estimating stroke volume by means of thoracic electrical bioimpedance calculates the product of a patient constant CP (in ml), the mean blood velocity index FT (measured in s−1 during flow time, and FT (flow time measured in s):The model of Electrical Velocimetry derives the mean blood velocity index
FT from the measured index for peak aortic acceleration ICON. The higher the mean blood velocity during flow time, the more SV the left ventricle ejects. The 'volume of electrically participating tissue' (VEPT) is used as the patient constant. The VEPT is derived primarily from the body mass.Impedance Cardiography
Impedance cardiographyImpedance cardiography
Impedance cardiography is a plethysmography technique of using sensors to detect the properties of the blood flow in the thorax.-Introduction:...
is a method of non-invasively monitoring hemodynamics, through the use of 4 dual sensors placed on the neck and chest. Both Impedance cardiography and Electrical Cardiometry derive SV and CO from measurements of TEB, but the underlying model is what differs. The Impedance Cardiography model contributes the rapid change of bioimpedance which occurs shortly after aortic valve opening to the expansion of the compliant ascending aorta, assuming that more blood volume temporarily stored in the ascending aorta contributes to a decrease in bioimpedance (or an increase in conductity of the thorax). The underlying model never proved accurate in patients with small cardiac outputs, hence it was never U.S. FDA approved for use in children or neonates.
Parameters
The electrical and impedance signals are processed, and then utilized to measure and calculate hemodynamic parameters such as cardiac output, stroke volume, systemic vascular resistance, thoracic fluid index, ICON (index of contractility), and systolic time ratio.| Parameter | Definition |
|---|---|
| Heart Rate | Number of heart beats each minute |
| Cardiac Output | Amount of blood pumped by the left ventricle each minute |
| Cardiac Index | Cardiac output normalized for body surface area |
| Stroke Volume | Amount of blood pumped by the left ventricle each heartbeat |
| Stroke Volume Variation | Variation of Stroke Volume beat to beat |
| Stroke Index | Stroke volume normalized for body surface area |
| Systemic Vascular Resistance | The resistance to the flow of blood in the vasculature (often referred to as “Afterload”) |
| Systemic Vascular Resistance Index | Systemic vascular resistance normalized for body surface area |
| ICON | Index of contractility. Peak acceleration of blood flow in the aorta |
| VIC | Variation of ICON |
| Thoracic Fluid Index | The electrical conductivity of the chest cavity, which is primarily determined by the intravascular, intraalveolar, and interstitial fluid Interstitial fluid Interstitial fluid is a solution that bathes and surrounds the cells of multicellular animals. It is the main component of the extracellular fluid, which also includes plasma and transcellular fluid... s in the thorax |
| Left Cardiac Work | An indicator of the amount of work the left ventricle must perform to pump blood each minute |
| Systolic Time Ratio | The ratio of the electrical and mechanical systole |
| Pre Ejection Period | The time interval from the beginning of electrical stimulation of the ventricles to the opening of the aortic valve (electrical systole) |
| Left Ventricular Ejection Time | The time interval from the opening to the closing of the aortic valve (mechanical systole) |