
.gif)
Dot plot (bioinformatics)
Encyclopedia
A dot plot is a graphical method that allows the comparison of two biological sequences
and identify regions of close similarity between them. It is a kind of recurrence plot
.
Some idea of the similarity of the two sequences can be gleaned from the number and length of matching segments shown in the matrix. Identical proteins will obviously have a diagonal line in the center of the matrix. Insertions and deletions between sequences give rise to disruptions in this diagonal. Regions of local similarity or repetitive sequences give rise to further diagonal matches in addition to the central diagonal. Because of the limited protein alphabet, many matching sequence segments may simply have arisen by chance. One way of reducing this noise is to only shade runs or 'tuple
s' of residues, e.g. a tuple of 3 corresponds to three residues in a row. This is effective because the probability of matching three residues in a row by chance is much lower than single-residue matches. It can be seen from Figures 3.3h,c that the number of diagonal runs in the matrix has been considerably reduced by looking for 2-tuples or 3-tuples.
Dot plots are one of the oldest ways of comparing two sequences. They compare two sequences by organizing one sequence on the x-axis, and another on the y-axis, of a plot. When the residues of both sequences match at the same location on the plot, a dot is drawn at the corresponding position. Note, that the sequences can be written backwards or forwards, however the sequences on both axes must be written in the same direction. Also note, that the direction of the sequences on the axes will determine the direction of the line on the dot plot. Once the dots have been plotted, they will combine to form lines. The closeness of the sequences in similarity will determine how close the diagonal line is to what a graph showing a curve demonstrating a direct relationship
is. This relationship is affected by certain sequence features such as frame shifts, direct repeats, and inverted repeats. Frame shifts include insertions, deletions, and mutations. The presence of one of these features, or the presence of multiple features, will cause for multiple lines to be plotted in a various possibility of configurations, depending on the features present in the sequences. A feature that will cause a very different result on the dot plot is the presence of low-complexity region/regions. Low-complexity regions are regions in the sequence with only a few amino acids, which in turn, causes redundancy within that small or limited region. These regions are typically found around the diagonal, and may or may not have a square in the middle of the dot plot.
 Example of a dot plot for comparing two simple protein sequences:
This is constrained to be within the window given by the two black lines parallel to the central diagonal. An alternative high-scoring path is also shown.
Sequence (biology)
A sequence in biology is the one-dimensional ordering of monomers, covalently linked within in a biopolymer; it is also referred to as the primary structure of the biological macromolecule.-See also:* Protein sequence* DNA sequence...
and identify regions of close similarity between them. It is a kind of recurrence plot
Recurrence plot
In descriptive statistics and chaos theory, a recurrence plot is a plot showing, for a given moment in time, the times at which a phase space trajectory visits roughly the same area in the phase space...
.
Introduction
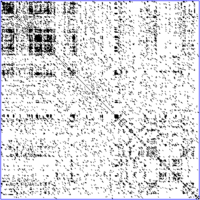
One way to visualize the similarity between two protein or nucleic acid sequences is to use a similarity matrix, known as a dot plot. These were introduced by Philips in the 1970s and are two-dimensional matrices that have the sequences of the proteins being compared along the vertical and horizontal axes. For a simple visual representation of the similarity between two sequences, individual cells in the matrix can be shaded black if residues are identical, so that matching sequence segments appear as runs of diagonal lines across the matrix.Some idea of the similarity of the two sequences can be gleaned from the number and length of matching segments shown in the matrix. Identical proteins will obviously have a diagonal line in the center of the matrix. Insertions and deletions between sequences give rise to disruptions in this diagonal. Regions of local similarity or repetitive sequences give rise to further diagonal matches in addition to the central diagonal. Because of the limited protein alphabet, many matching sequence segments may simply have arisen by chance. One way of reducing this noise is to only shade runs or 'tuple
Tuple
In mathematics and computer science, a tuple is an ordered list of elements. In set theory, an n-tuple is a sequence of n elements, where n is a positive integer. There is also one 0-tuple, an empty sequence. An n-tuple is defined inductively using the construction of an ordered pair...
s' of residues, e.g. a tuple of 3 corresponds to three residues in a row. This is effective because the probability of matching three residues in a row by chance is much lower than single-residue matches. It can be seen from Figures 3.3h,c that the number of diagonal runs in the matrix has been considerably reduced by looking for 2-tuples or 3-tuples.
Dot plots are one of the oldest ways of comparing two sequences. They compare two sequences by organizing one sequence on the x-axis, and another on the y-axis, of a plot. When the residues of both sequences match at the same location on the plot, a dot is drawn at the corresponding position. Note, that the sequences can be written backwards or forwards, however the sequences on both axes must be written in the same direction. Also note, that the direction of the sequences on the axes will determine the direction of the line on the dot plot. Once the dots have been plotted, they will combine to form lines. The closeness of the sequences in similarity will determine how close the diagonal line is to what a graph showing a curve demonstrating a direct relationship
Direct relationship
In mathematics and statistics, a positive or direct relationship is a relationship between two variables in which change in one variable is associated with a change in the other variable in the same direction. For example all linear relationships with a positive slope are direct relationships...
is. This relationship is affected by certain sequence features such as frame shifts, direct repeats, and inverted repeats. Frame shifts include insertions, deletions, and mutations. The presence of one of these features, or the presence of multiple features, will cause for multiple lines to be plotted in a various possibility of configurations, depending on the features present in the sequences. A feature that will cause a very different result on the dot plot is the presence of low-complexity region/regions. Low-complexity regions are regions in the sequence with only a few amino acids, which in turn, causes redundancy within that small or limited region. These regions are typically found around the diagonal, and may or may not have a square in the middle of the dot plot.
Example
- All cells associated with identical residue pairs between the sequences are shaded black;
- Only those cells associated with identical tuples of two residues are shaded black; and,
- Only cells associated with tuples of three are shaded and the optimal path through the matrix has been drawn.
This is constrained to be within the window given by the two black lines parallel to the central diagonal. An alternative high-scoring path is also shown.
External links
- A tutorial
- Genomdiff — an open source Java Dot Plot program for viruses
- Gepard
- ANACON — Contact analysis of dot plots.
- General introduction to dot plots with example algorithms and a software tool to create small and medium size dot plots.
- Dotlet — provides a program allowing you to construct a dot plot with your own sequences.
- UGENE Dot Plot viewer - a powerful and opensource Dot Plot visualizer