

Covered call
Encyclopedia
Call option
A call option, often simply labeled a "call", is a financial contract between two parties, the buyer and the seller of this type of option. The buyer of the call option has the right, but not the obligation to buy an agreed quantity of a particular commodity or financial instrument from the seller...
s owns the corresponding amount of the underlying instrument, such as shares of a stock or other securities. If a trader buys the underlying instrument at the same time as he sells the call, the strategy is often called a "buy-write
Buy-write
The term buy-write is used to describe an investment strategy in which the investor buys stocks and writes call options against the stock position...
" strategy. In equilibrium, the strategy has the same payoffs as writing a put option.
The long position in the underlying instrument is said to provide the "cover" as the shares can be delivered to the buyer of the call if the buyer decides to exercise
Exercise (options)
The owner of an option contract may exercise it, indicating that the financial transaction specified by the contract is to be enacted immediately between the two parties, and the contract itself is terminated...
.
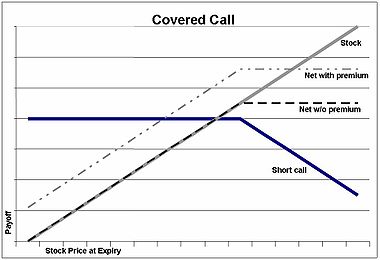
Writing (aka selling) a call generates income in the form of the premium paid by the option buyer. And if the stock price remains stable or increases, then the writer will be able to keep this income as a profit, even though the profit may have been higher if no call were written. The risk of stock ownership is not eliminated. If the stock price declines, then the net position will likely lose money.
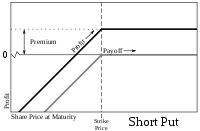
Since in equilibrium [reader: what does this mean?] the payoffs on the covered call position is the same as a short put
Put option
A put or put option is a contract between two parties to exchange an asset, the underlying, at a specified price, the strike, by a predetermined date, the expiry or maturity...
position, the price (or premium) should be the same as the premium of the short put or naked put
Naked put
A naked put is a put option where the option writer does not have a position in the underlying stock or other instrument. This strategy is best used by investors who want to accumulate a position in the underlying stock - but only if the price is low enough...
.
Examples
An investor has 500 shares of XYZ stock, valued at $10,000. He sells 5 call option contracts (in the US, 1 option contract covers 100 shares) for $1500 , thus covering a certain amount of decrease in the XYZ stock (i.e. only after the stock value has declined by more than $1500 would the investor lose money overall). Losses cannot be prevented, but merely reduced in a covered call position. If the stock price drops, it will not make sense for the option buyer to exercise the option at the higher strike price since the stock can now be purchased cheaper at the market price, and the seller (writer) will keep the money paid on the premium of the option, thus reducing his loss from a maximum of $10000 to [$10000 - (premium)], or $8500.This "protection" has its potential disadvantage in that the investor (option writer) may be forced to sell his stock below market price at expiration, or must buy back the calls at a price higher than he sold them for.
If, before expiration, the spot price
Spot price
The spot price or spot rate of a commodity, a security or a currency is the price that is quoted for immediate settlement . Spot settlement is normally one or two business days from trade date...
does not reach the strike price, the investor might repeat the same process again if he/she believes that stock will either fall or be neutral.
A call option can be sold even if the option writer doesn't initially own the underlying stock. If XYZ trades at $33 and $35 calls are priced at $1, then an investor can purchase 100 shares of XYZ for $3300 and sell one (100-share) call option for $100, for a net cost of only $3200. The $100 premium received for the call will cover a $1 decline in stock price. The break-even
Breakeven
In economics & business, specifically cost accounting, the break-even point is the point at which cost or expenses and revenue are equal: there is no net loss or gain, and one has "broken even"...
point of the transaction is $32/share. Upside potential is limited to $300, but this amounts to a return of almost 10%. (If the stock price rises to $35 or more, the call option holder will exercise his option and the investor's profit will be $35–$32 = $3). If the stock price at expiry is below $35 but above $32, the call option will be allowed to expire, but the investor can still profit by selling his shares. Only if the price is below $32/share will the investor experience a loss.
| Stock price at expiration |
Net profit/loss | Comparison to simple stock purchase |
|---|---|---|
| $30 | (200) | (300) |
| $31 | (100) | (200) |
| $32 | 0 | (100) |
| $33 | 100 | 0 |
| $34 | 200 | 100 |
| $35 | 300 | 200 |
| $36 | 300 | 300 |
| $37 | 300 | 400 |
Concrete example
Presenting a concrete example of a buy-write expiry payout, one will be able to see and understand what is the expiry value of a portfolio as a function of the option they wrote, and the stock price at expiry. See the 3D mesh plot and discussion."The Figure on the right shows a 3-Dimensional plot of expiry value versus stock price for FCX on expiry Saturday versus the option purchased. Please take a few moments to study the chart making careful note of the Y-axis which represents the option purchased in the format of (Strike Price) - (Days to Expiry), e.g. 70-10 would be 70 dollars and 10 days to expiry, and 85-101 would be an 85 dollar strike price with 101 days to expiry."
Taking a look at one slice (left) of the above data, namely what is the portfolio value if the stock price is $85 at expiry. This plot shows the Strike Price - Days to expiry vs the portfolio’s value at expiry. It is worth taking a couple of minutes to choke down what this plot is really presenting. Stepping through the data, the bottom axis shows various call options which an investor could write (AKA sell or short). Each of the options indicates the number of days to expiry. The plot does not show the portfolio value of each of the options on the same day, instead the plot is showing the portfolio value at expiry. However, for some of the options expiry is 710 days away, and for other options expiry is only 10 days away. The implication of this is that for some of the positions you will have to wait a long time to realize the profit. Finally this chart makes the other assumption that the stock price is $85 at expiry. This is the case of being called for all the options. What this boundary condition presents is the maximum profit that this portfolio could have.
Marketing
This strategy is sometimes marketed as being "safe" or "conservative" and even "hedging risk" as it provides premium income, but its flaws have been well known at least since 1975 when Fischer BlackFischer Black
Fischer Sheffey Black was an American economist, best known as one of the authors of the famous Black–Scholes equation.-Background:...
published "Fact and Fantasy in the Use of Options". According to Reilly and Brown (2003); "to be profitable, the covered call strategy requires that the investor guess correctly that share values will remain in a reasonably narrow band around their present levels." (p. 995)
Two recent developments may have increased interest in covered call strategies: (1) in 2002 the Chicago Board Options Exchange
Chicago Board Options Exchange
The Chicago Board Options Exchange , located at 400 South LaSalle Street in Chicago, is the largest U.S. options exchange with annual trading volume that hovered around one billion contracts at the end of 2007...
introduced a benchmark index for covered call strategies, the CBOE S&P 500 BuyWrite Index (ticker BXM), and (2) in 2004 the Ibbotson Associates consulting firm published a case study on buy-write strategies.
External links
- Chicago Board Options Exchange
- Covered Call Worksheet.
- Benchmark Indexes for Buy-write Strategies.
- Option ScreenersOption screenerAn option screener is a tool that evaluates options based on criteria and generates a list of potential trading ideas. Most people who trade options are technical traders. It essentially means they look for patterns in charts. Also they use statistical correlations and deviations and give them...
.