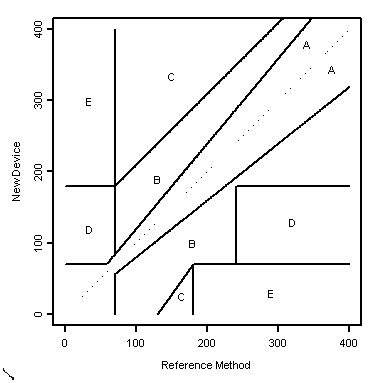
Clarke error grid
Encyclopedia

Glucose
Glucose is a simple sugar and an important carbohydrate in biology. Cells use it as the primary source of energy and a metabolic intermediate...
as compared to the blood glucose value obtained in their meter. It was then used to quantify the clinical accuracy of blood glucose estimates generated by meters as compared to a reference value. A description of the EGA appeared in Diabetes Care in 1987. Eventually, the EGA became accepted as one of the “gold standards” for determining the accuracy of blood glucose meters.
The grid breaks down a scatterplot
Scatterplot
A scatter plot or scattergraph is a type of mathematical diagram using Cartesian coordinates to display values for two variables for a set of data....
of a reference glucose meter and an evaluated glucose meter into five regions:
- Region A are those values within 20% of the reference sensor,
- Region B contains points that are outside of 20% but would not lead to inappropriate treatment,
- Region C are those points leading to unnecessary treatment,
- Region D are those points indicating a potentially dangerous failure to detect hypoglycemia or hyperglycemiaHyperglycemiaHyperglycemia or Hyperglycæmia, or high blood sugar, is a condition in which an excessive amount of glucose circulates in the blood plasma. This is generally a glucose level higher than 13.5mmol/l , but symptoms may not start to become noticeable until even higher values such as 15-20 mmol/l...
, and - Region E are those points that would confuse treatment of hypoglycemia] for hyperglycemia and vice-versa.

