

Cartogram
Encyclopedia
Map
A map is a visual representation of an area—a symbolic depiction highlighting relationships between elements of that space such as objects, regions, and themes....
in which some thematic mapping variable – such as travel time or Gross National Product – is substituted for land area or distance. The geometry or space of the map is distorted in order to convey the information of this alternate variable. There are two main types of cartograms: area and distance cartograms.
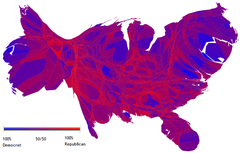
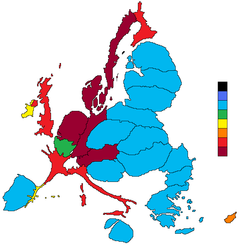
Area cartograms
An area cartogram is sometimes referred to as a value-by-area map or an isodemographic map, the latter particularly for a population cartogram, which illustrates the relative sizes of the populationPopulation
A population is all the organisms that both belong to the same group or species and live in the same geographical area. The area that is used to define a sexual population is such that inter-breeding is possible between any pair within the area and more probable than cross-breeding with individuals...
s of the countries of the world by scaling the area of each country in proportion to its population; the shape and relative location of each country is retained to as large an extent as possible, but inevitably a large amount of distortion results. Other synonyms in use are anamorphic map and density-equalizing map.
Distance cartogram
A distance cartogram may also be called a central-point cartogram. This form is typically used to show relative travel times and directions from vertices in a network.Production
One of the first cartographers to generate cartograms with the aid of computer visualization was Waldo Tobler of UC Santa BarbaraUniversity of California, Santa Barbara
The University of California, Santa Barbara, commonly known as UCSB or UC Santa Barbara, is a public research university and one of the 10 general campuses of the University of California system. The main campus is located on a site in Goleta, California, from Santa Barbara and northwest of Los...
in the 1960s. Prior to Tobler's work, cartograms were created by hand (as they occasionally still are). A number of software packages generate cartograms.
Further reading
- Campbell, John. Map Use and Analysis. New York: McGraw-Hill, 2001.
- Gillard, Quentin. "Places in the News: The Use of Cartograms in Introductory Geography Courses." Journal of Geography. 78 (1979): 114-115.
- Tobler, Waldo. "Thirty-Five Years of Computer Cartograms." Annals of the Association of American Geographers. 94 (2004): 58-73.
- Vescovo, Victor. "The Atlas of World Statistics." Dallas: Caladan Press, 2005.