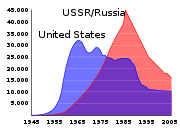
Area chart
Encyclopedia


Line chart
A line chart or line graph is a type of graph, which displays information as a series of data points connected by straight line segments. It is a basic type of chart common in many fields. It is an extension of a scatter graph, and is created by connecting a series of points that represent...
. The area between axis and line are commonly emphasized with colors, textures and hatchings. Commonly one compares with an area chart two or more quantities.

