

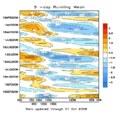
Hovmöller diagram
Encyclopedia
Graph of a function
In mathematics, the graph of a function f is the collection of all ordered pairs . In particular, if x is a real number, graph means the graphical representation of this collection, in the form of a curve on a Cartesian plane, together with Cartesian axes, etc. Graphing on a Cartesian plane is...
meteorological
Meteorology
Meteorology is the interdisciplinary scientific study of the atmosphere. Studies in the field stretch back millennia, though significant progress in meteorology did not occur until the 18th century. The 19th century saw breakthroughs occur after observing networks developed across several countries...
data to highlight the role of wave
Wave
In physics, a wave is a disturbance that travels through space and time, accompanied by the transfer of energy.Waves travel and the wave motion transfers energy from one point to another, often with no permanent displacement of the particles of the medium—that is, with little or no associated mass...
s. The axes
Cartesian coordinate system
A Cartesian coordinate system specifies each point uniquely in a plane by a pair of numerical coordinates, which are the signed distances from the point to two fixed perpendicular directed lines, measured in the same unit of length...
of a Hovmöller diagram are typically longitude
Longitude
Longitude is a geographic coordinate that specifies the east-west position of a point on the Earth's surface. It is an angular measurement, usually expressed in degrees, minutes and seconds, and denoted by the Greek letter lambda ....
or latitude
Latitude
In geography, the latitude of a location on the Earth is the angular distance of that location south or north of the Equator. The latitude is an angle, and is usually measured in degrees . The equator has a latitude of 0°, the North pole has a latitude of 90° north , and the South pole has a...
(abscissa or x-axis) and time (ordinate or y-axis) with the value of some field
Field (physics)
In physics, a field is a physical quantity associated with each point of spacetime. A field can be classified as a scalar field, a vector field, a spinor field, or a tensor field according to whether the value of the field at each point is a scalar, a vector, a spinor or, more generally, a tensor,...
represented through color or shading. Hovmöller diagrams are also used to plot the time evolution of vertical profiles of scalar quantities such as temperature
Temperature
Temperature is a physical property of matter that quantitatively expresses the common notions of hot and cold. Objects of low temperature are cold, while various degrees of higher temperatures are referred to as warm or hot...
, density
Density
The mass density or density of a material is defined as its mass per unit volume. The symbol most often used for density is ρ . In some cases , density is also defined as its weight per unit volume; although, this quantity is more properly called specific weight...
, or concentrations of constituents in the atmosphere
Atmosphere
An atmosphere is a layer of gases that may surround a material body of sufficient mass, and that is held in place by the gravity of the body. An atmosphere may be retained for a longer duration, if the gravity is high and the atmosphere's temperature is low...
or ocean
Ocean
An ocean is a major body of saline water, and a principal component of the hydrosphere. Approximately 71% of the Earth's surface is covered by ocean, a continuous body of water that is customarily divided into several principal oceans and smaller seas.More than half of this area is over 3,000...
. In that case time is plotted along the abscissa and vertical position (depth, height, pressure) along the ordinate.
The diagram was invented by Ernest Aabo Hovmöller (1912-2008), a Danish meteorologist, in a paper of 1949.