

Fisher's noncentral hypergeometric distribution
Encyclopedia
Probability theory
Probability theory is the branch of mathematics concerned with analysis of random phenomena. The central objects of probability theory are random variables, stochastic processes, and events: mathematical abstractions of non-deterministic events or measured quantities that may either be single...
and statistics
Statistics
Statistics is the study of the collection, organization, analysis, and interpretation of data. It deals with all aspects of this, including the planning of data collection in terms of the design of surveys and experiments....
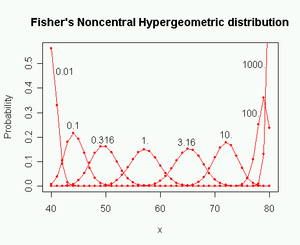
, Fisher's noncentral hypergeometric distribution is a generalization of the hypergeometric distribution where sampling probabilities are modified by weight factors. Fisher's noncentral hypergeometric distribution can also be defined as the conditional distribution of two or more binomially distributed variables dependent upon their fixed sum.
The distribution may be illustrated by the following urn model
Urn problem
In probability and statistics, an urn problem is an idealized mental exercise in which some objects of real interest are represented as colored balls in an urn or other container....
. Assume, for example, that an urn contains m1 red balls and m2 white balls, totalling N = m1 + m2 balls. Each red ball has the weight ω1 and each white ball has the weight ω2. We will say that the odds ratio is ω = ω1 / ω2. Now we are taking balls randomly in such a way that the probability of taking a particular ball is proportional to its weight, but independent of what happens to the other balls. The number of balls taken of a particular color follows the binomial distribution. If the total number n of balls taken is known then the conditional distribution of the number of taken red balls for given n is Fisher's noncentral hypergeometric distribution. To generate this distribution experimentally, we have to repeat the experiment until it happens to give n balls.
If we want to fix the value of n prior to the experiment then we have to take the balls one by one until we have n balls. The balls are therefore no longer independent. This gives a slightly different distribution known as Wallenius' noncentral hypergeometric distribution
Wallenius' noncentral hypergeometric distribution
In probability theory and statistics, Wallenius' noncentral hypergeometric distribution is a generalization of the hypergeometric distribution where items are sampled with bias....
. It is far from obvious why these two distributions are different. See the entry for noncentral hypergeometric distributions
Noncentral hypergeometric distributions
In statistics, the hypergeometric distribution is the discrete probability distribution generated by picking colored balls at random from an urn without replacement....
for an explanation of the difference between these two distributions and a discussion of which distribution to use in various situations.
The two distributions are both equal to the (central) hypergeometric distribution when the odds ratio is 1.
Unfortunately, both distributions are known in the literature as "the" noncentral hypergeometric distribution. It is important to be specific about which distribution is meant when using this name.
Fisher's noncentral hypergeometric distribution was first given the name extended hypergeometric distribution (Harkness, 1965), but this name is rarely used today.
Univariate distribution
The probability function, mean and variance are given in the table to the right.An alternative expression of the distribution has both the number of balls taken of each color and the number of balls not taken as random variables, whereby the expression for the probability becomes symmetric.
The calculation time for the probability function can be high when the sum in P0 has many terms. The calculation time can be reduced by calculating the terms in the sum recursively relative to the term for y = x and ignoring negligible terms in the tails (Liao and Rosen, 2001).
The mean can be approximated by:
 ,
,where
 ,
,  ,
,  .
.The variance can be approximated by:
 .
.Better approximations to the mean and variance are given by Levin (1984), Liao (1992), McCullagh and Nelder (1989).
Properties
The following symmetry relations apply:


Recurrence relation:

Multivariate distribution
The distribution can be expanded to any number of colors c of balls in the urn. The multivariate distribution is used when there are more than two colors.The probability function and a simple approximation to the mean are given to the right. Better approximations to the mean and variance are given by McCullagh and Nelder (1989).
Properties
The order of the colors is arbitrary so that any colors can be swapped.The weights can be arbitrarily scaled:
 for all
Colors with zero number (mi = 0) or zero weight (ωi = 0) can be omitted from the equations.
Colors with the same weight can be joined:
where
 is the (univariate, central) hypergeometric distribution probability.
Applications
Fisher's noncentral hypergeometric distribution is useful for models of biased sampling or biased selection where the individual items are sampled independently of each other with no competition. The bias or odds can be estimated from an experimental value of the mean. Use Wallenius' noncentral hypergeometric distributionWallenius' noncentral hypergeometric distribution
In probability theory and statistics, Wallenius' noncentral hypergeometric distribution is a generalization of the hypergeometric distribution where items are sampled with bias....
instead if items are sampled one by one with competition.
Fisher's noncentral hypergeometric distribution is used mostly for tests in contingency table
Contingency table
In statistics, a contingency table is a type of table in a matrix format that displays the frequency distribution of the variables...
s where a conditional distribution for fixed margins is desired. This can be useful e.g. for testing or measuring the effect of a medicine. See McCullagh and Nelder (1989).
Software available
- FisherHypergeometricDistribution in MathematicaMathematicaMathematica is a computational software program used in scientific, engineering, and mathematical fields and other areas of technical computing...
. - An implementation for the R programming languageR (programming language)R is a programming language and software environment for statistical computing and graphics. The R language is widely used among statisticians for developing statistical software, and R is widely used for statistical software development and data analysis....
is available as the package named BiasedUrn. Includes univariate and multivariate probability mass functions, distribution functions, quantileQuantileQuantiles are points taken at regular intervals from the cumulative distribution function of a random variable. Dividing ordered data into q essentially equal-sized data subsets is the motivation for q-quantiles; the quantiles are the data values marking the boundaries between consecutive subsets...
s, random variableRandom variableIn probability and statistics, a random variable or stochastic variable is, roughly speaking, a variable whose value results from a measurement on some type of random process. Formally, it is a function from a probability space, typically to the real numbers, which is measurable functionmeasurable...
generating functions, mean and variance. - The RR (programming language)R is a programming language and software environment for statistical computing and graphics. The R language is widely used among statisticians for developing statistical software, and R is widely used for statistical software development and data analysis....
package MCMCpack includes the univariate probability mass function and random variable generating function. - SAS SystemSAS SystemSAS is an integrated system of software products provided by SAS Institute Inc. that enables programmers to perform:* retrieval, management, and mining* report writing and graphics* statistical analysis...
includes univariate probability mass function and distribution function. - Implementation in C++C++C++ is a statically typed, free-form, multi-paradigm, compiled, general-purpose programming language. It is regarded as an intermediate-level language, as it comprises a combination of both high-level and low-level language features. It was developed by Bjarne Stroustrup starting in 1979 at Bell...
is available from www.agner.org. - Calculation methods are described by Liao and Rosen (2001) and Fog (2008).
See also
- Noncentral hypergeometric distributionsNoncentral hypergeometric distributionsIn statistics, the hypergeometric distribution is the discrete probability distribution generated by picking colored balls at random from an urn without replacement....
- Wallenius' noncentral hypergeometric distributionWallenius' noncentral hypergeometric distributionIn probability theory and statistics, Wallenius' noncentral hypergeometric distribution is a generalization of the hypergeometric distribution where items are sampled with bias....
- Hypergeometric distribution
- Urn modelsUrn problemIn probability and statistics, an urn problem is an idealized mental exercise in which some objects of real interest are represented as colored balls in an urn or other container....
- Biased sampleBiased sampleIn statistics, sampling bias is when a sample is collected in such a way that some members of the intended population are less likely to be included than others. It results in a biased sample, a non-random sample of a population in which all individuals, or instances, were not equally likely to...
- BiasBias (statistics)A statistic is biased if it is calculated in such a way that it is systematically different from the population parameter of interest. The following lists some types of, or aspects of, bias which should not be considered mutually exclusive:...
- Contingency tableContingency tableIn statistics, a contingency table is a type of table in a matrix format that displays the frequency distribution of the variables...
- Fisher's exact testFisher's exact testFisher's exact test is a statistical significance test used in the analysis of contingency tables where sample sizes are small. It is named after its inventor, R. A...